Unraveling the Data with Yomi Olaoye: A Dive into Young Male Workers’ Wages in the US (data sample years: 1980–1987)


Table of contents
- Introduction:
- General View and Comparison with US Government Minimum Wage:
- Relationship between Occupations and Wage:
- Relationship between the Observation Years and Wages:
- Relationship between the Union Association and Wages:
- Relationship between Occupation, Union, and Wage
- Relationship between Years of Experience and Wage
- Conclusion:

Dataset: vincentarelbundock.github.io/Rdatasets/csv/..
Dataset info: vincentarelbundock.github.io/Rdatasets/doc/..
Analysis Code Repo: https://github.com/yomigeek/data-analysis-wages-education-US-1980-1987
Note: All wages are in per hour
Introduction:
In this data insight blog post, we will explore and analyze various aspects of wage data for young male workers between 1980 and 1987. We will compare these wages with the US government’s minimum wage during the same period, and examine the relationships between occupations, union affiliation, years of experience, and wages. We will also delve into the impact of outliers on the data and uncover intriguing findings that shed light on the wage dynamics of young male workers during this time.
Thus, this post tries to touch point on the following questions:
General view about the data, and compare with US gov minimum wage during the year 1980–1987.
Relationship between Occupations and wages — what kind of occupations have more wages?
Does belonging to a Union mean a higher wage?
Does years of experience have an effect on wages?
General View and Comparison with US Government Minimum Wage:
It is important to explore the area of comparing the data with the US government’s minimum wage between 1980 and 1987, we find that only a small fraction of workers earned the minimum wage or more during this period, with the majority earning less than the decade’s minimum wage [¹^]. This discrepancy highlights the importance of investigating other factors that contribute to wage disparities.
It’s essential to consider the economic context of the early 1980s when interpreting these findings. During that period, the US experienced the Early 1980s Recession, which was characterized by a sharp rise in oil prices and high inflation rates [²^]. These economic conditions could have impacted wage dynamics, leading to a considerable variation in wages among young male workers.
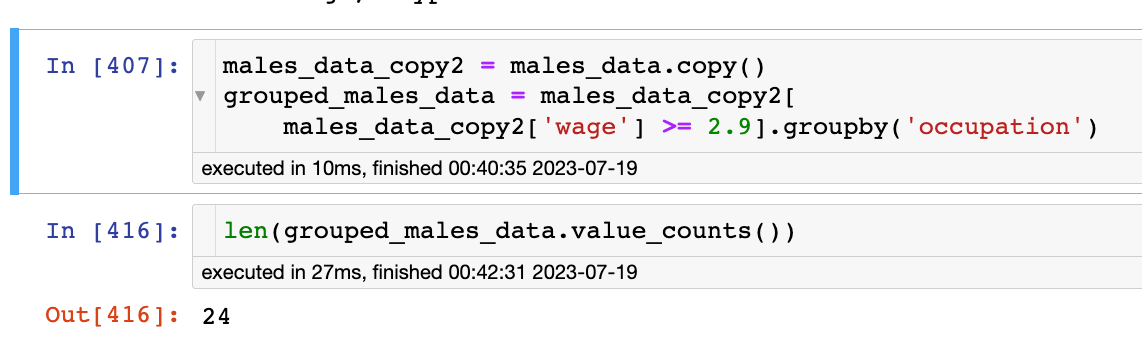
Number of workers that earned $2.9/hr or more between 1980–1987
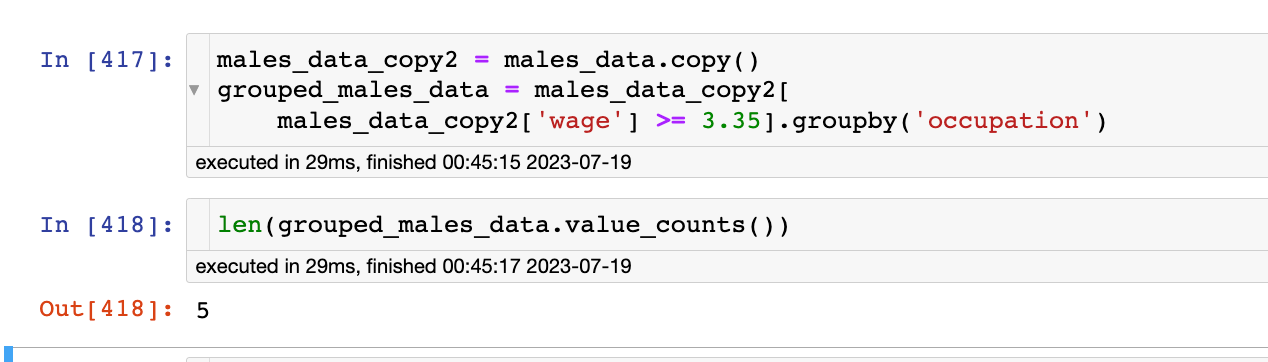
Number of workers that earned $3.35/hr or more between 1980–1987
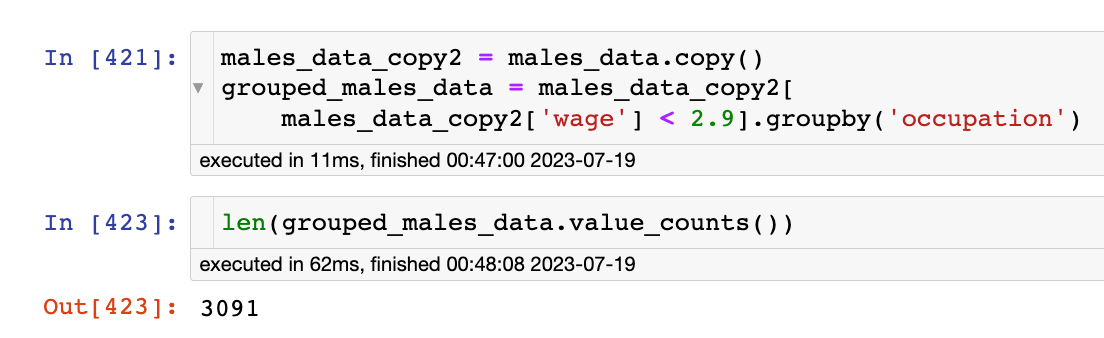
Number of workers that earned less than $2.9/hr between 1980–1987
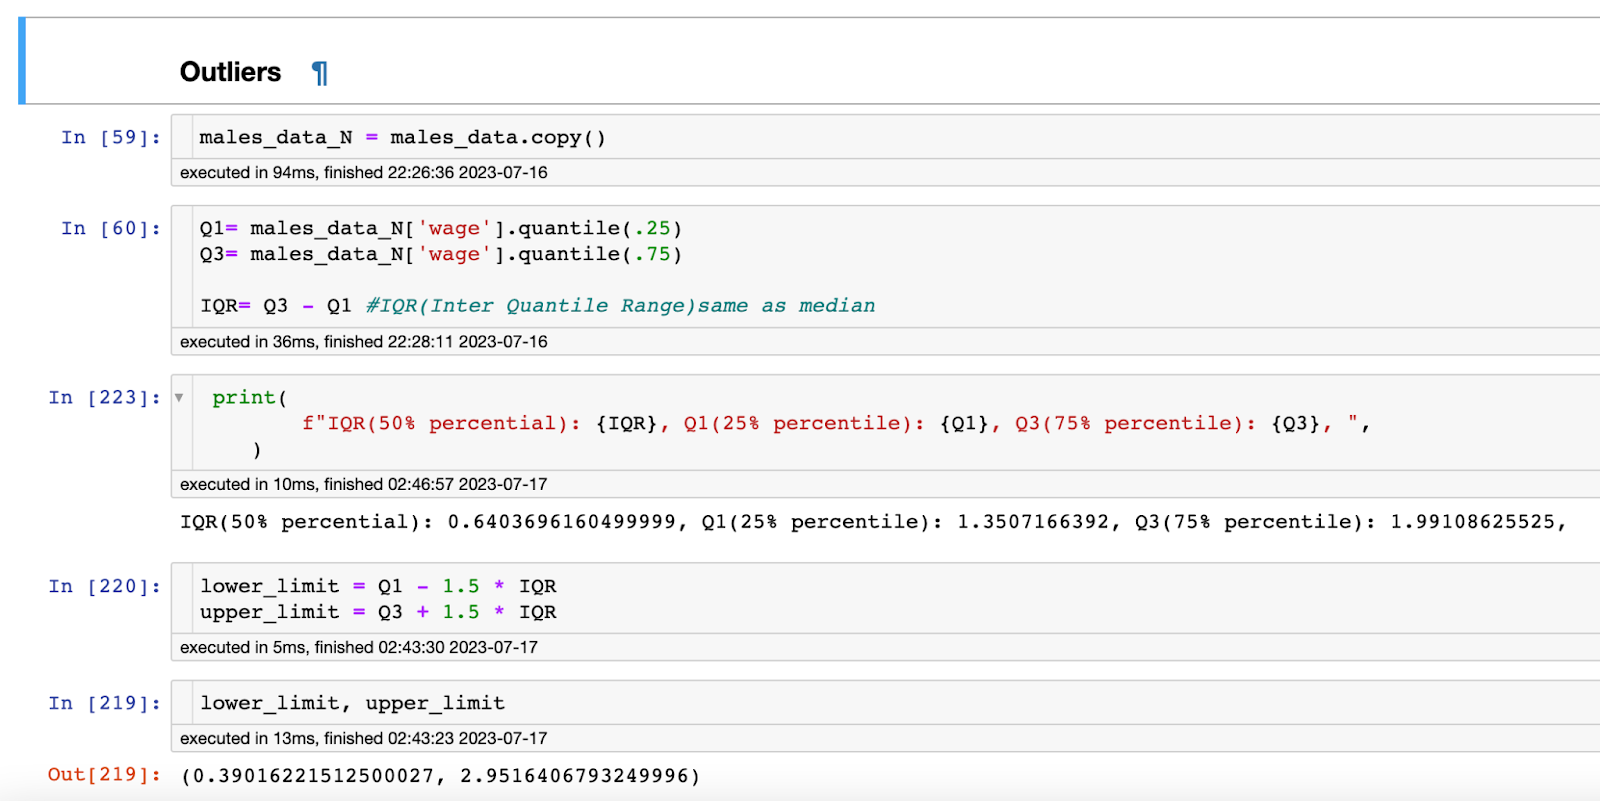
Our exploration of the data also reveals that the data is skewed to the left, indicating a higher median wage than the mean, and the existence of outliers on both sides of the data. The charts and computations below provide a view of the distribution and the outliers.
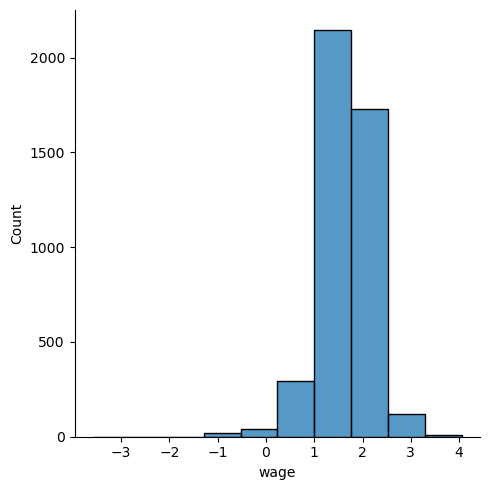
Wage distribution with outliers
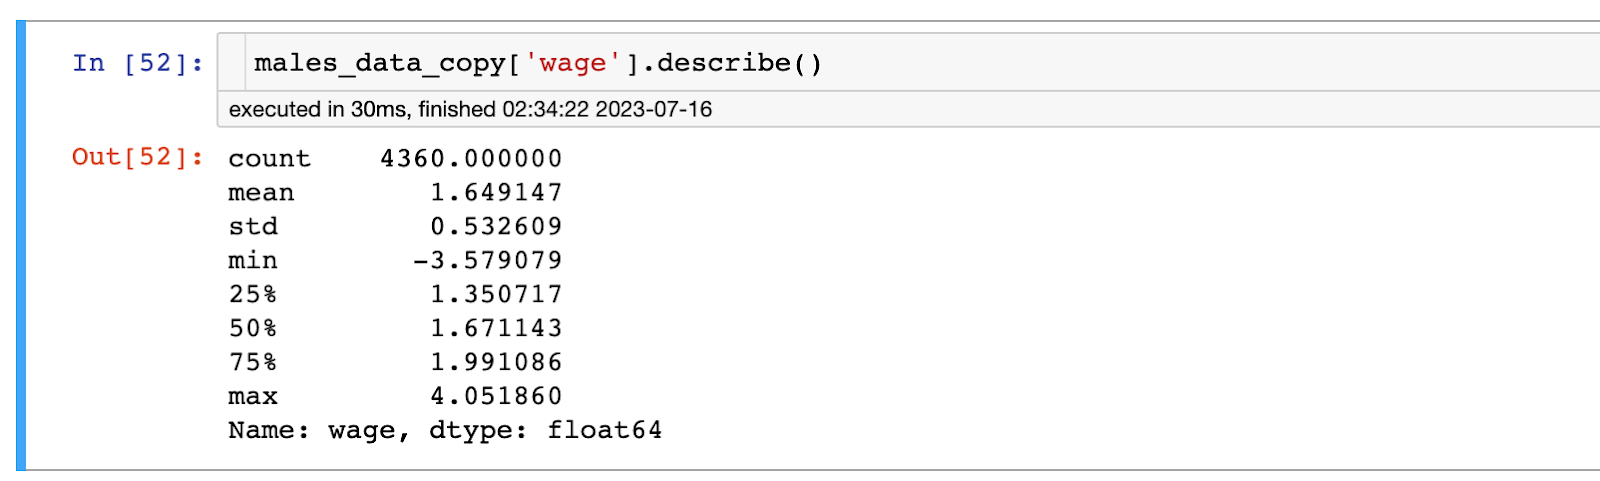
Our data Information before the computation and modifications based on the outliers
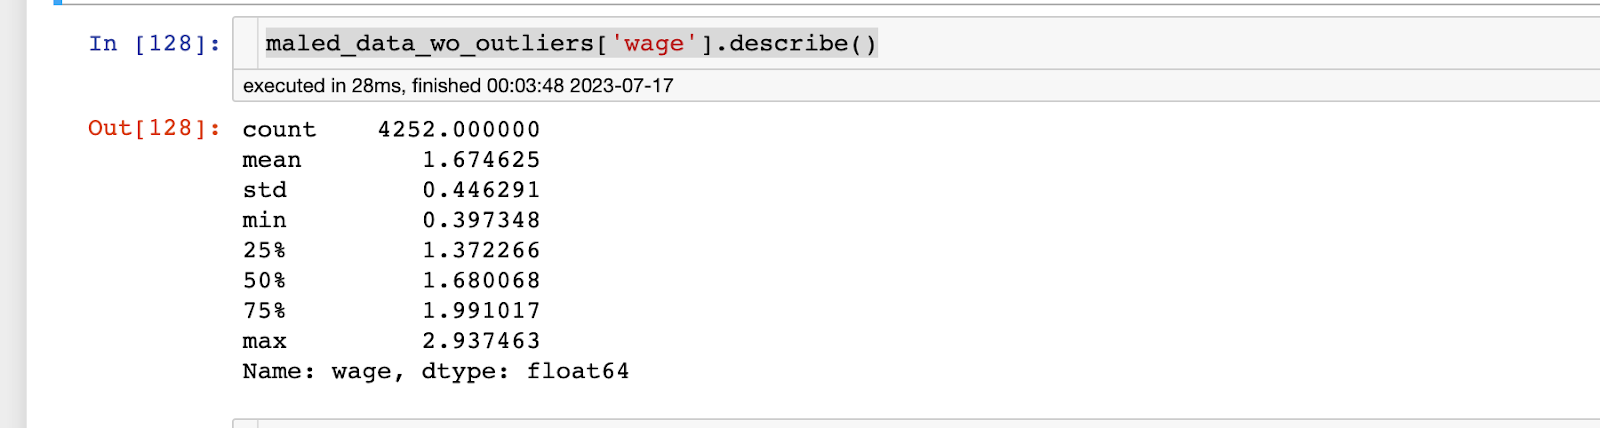
After upper and lower outliers were dropped
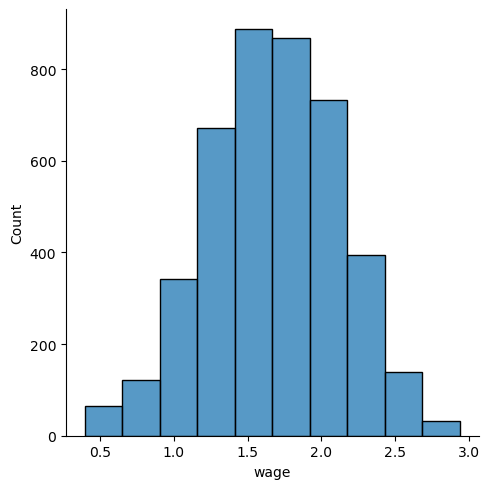
Wage distribution without outliers
Relationship between Occupations and Wage:
Working without outliers and Mean wage:
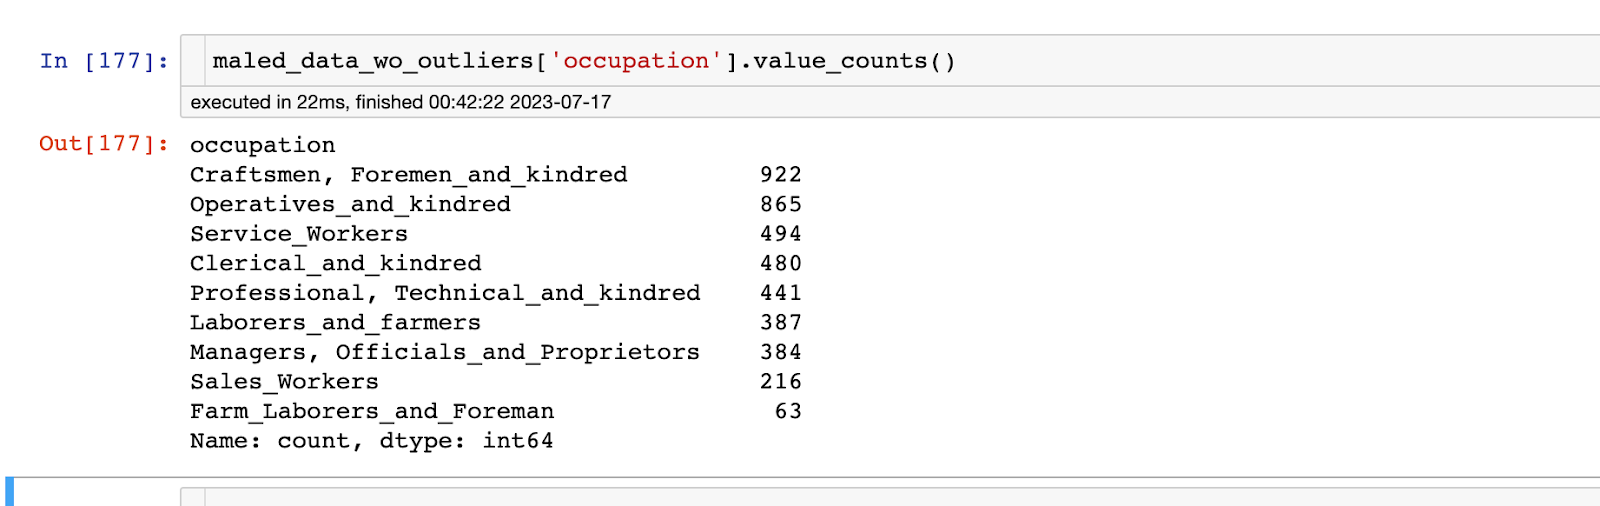
According to the data insight below, the Craftsmen, Foreman_and_kindred occupation category has the most people, while Farm_Labourers and Forement have the least.
Analyzing with mean values
Further analysis of the data below reveals, however, that the Professional, Technical_and_Kindred class has the highest mean wage, indicating that males in this group earn the highest and Farm_Laborers_and_Foreman earn the least. However, we need to determine whether other factors, such as belonging to a union, also play a role.
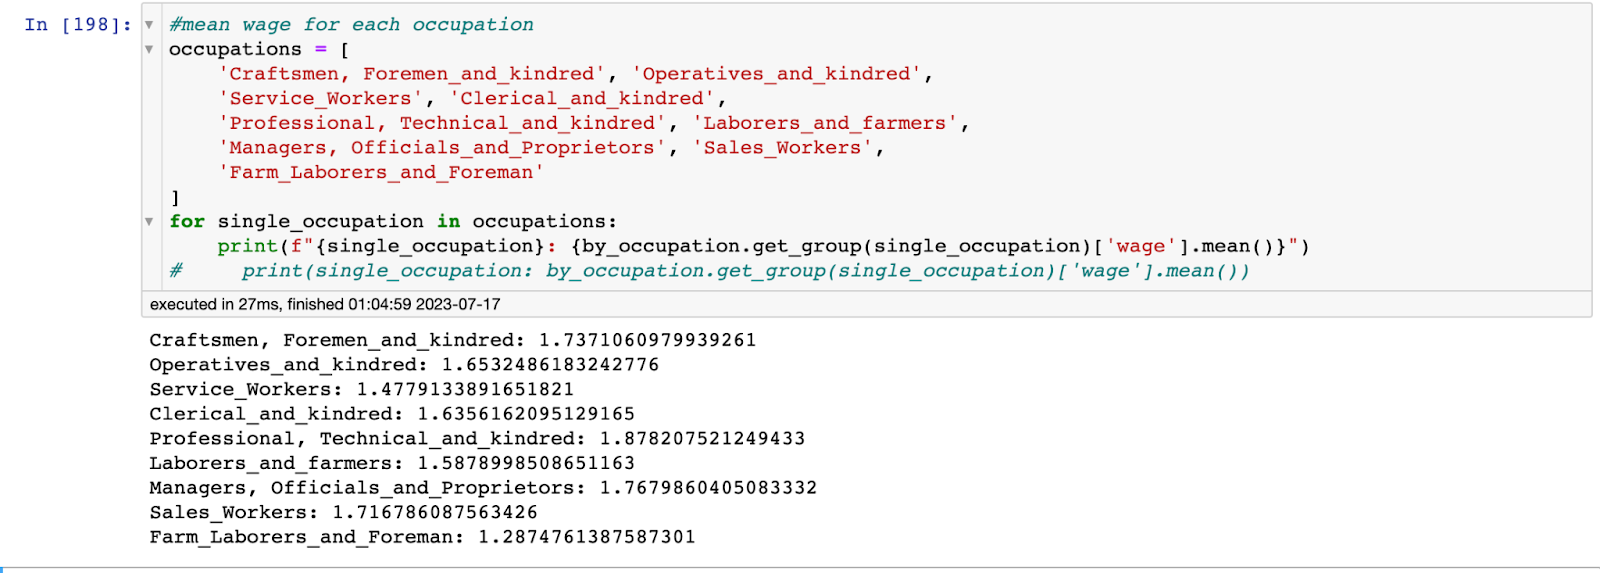
The mean wage for occupations without outliers
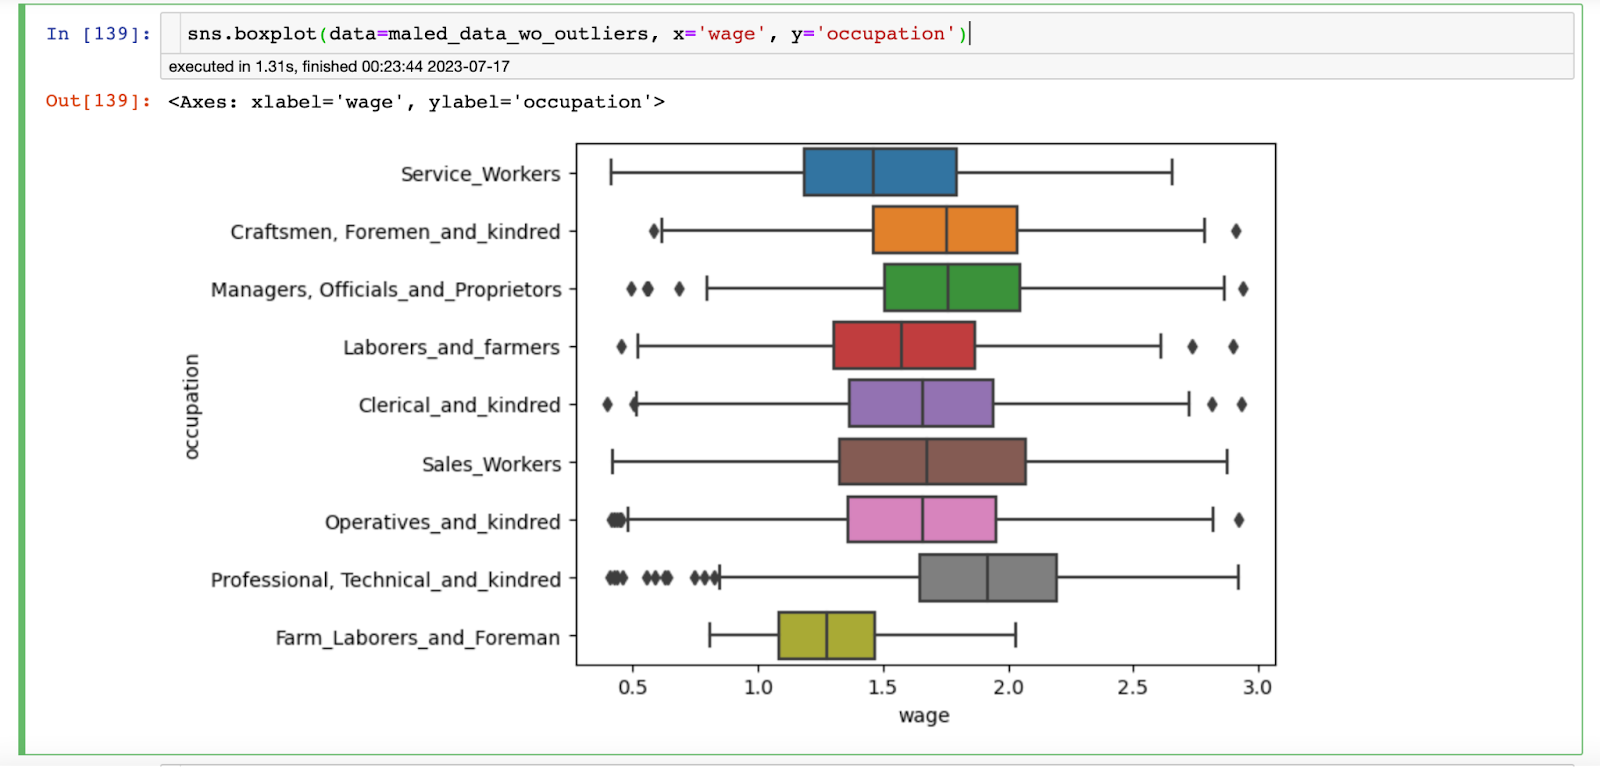
Box-plot of the various occupation alongside the wages of workers
Working with outliers:
Even with outliers, we still see that Professional, Technical_and_Kindred have the highest mean wage, which means males in this category still earn the most and Farm_Laborers_and_Foreman has the lowest. Although it is interesting to note that the mean wage differs between Craftsmen, Foremen_and_Kindred and Sales_Workers, the data without outliers showed that the mean wage for Craftsmen, Foremen_and_Kindred was higher than the mean wage for Sales_Workers, but without outliers, this indicates that some Sales_Workers earn more than the average. By looking at the median values, we will gain more insight.
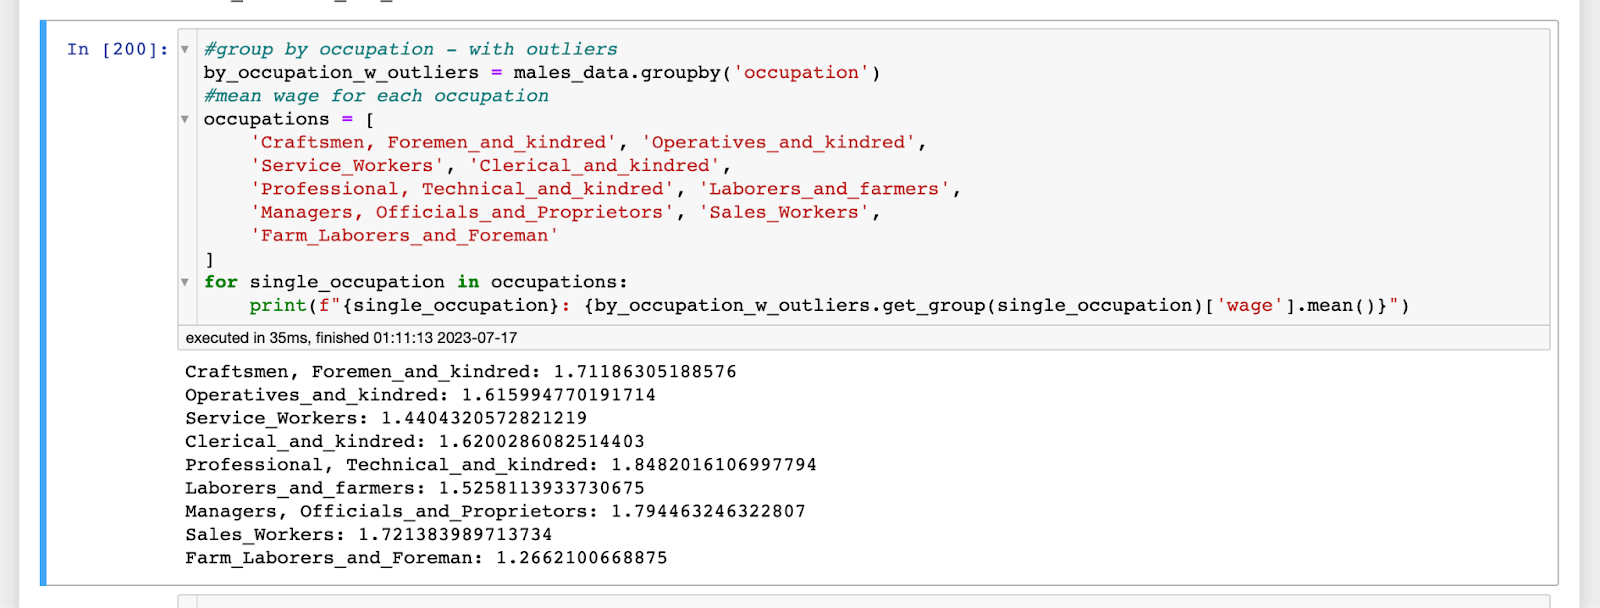
The mean wage of occupations with outliers
Working without outliers and Median wage:
Based on the median data above and the data with outliers, young professionals in the Professional, Technical_and_Kinderred occupations earn a much higher wage. Considering the mean value, it could be said there is a slight bit of an outlier in the earners in that occupation. It could also be said that the median shows that Craftsmen, Foremen_and_kindred occupation wage is higher than Sales_Workers.
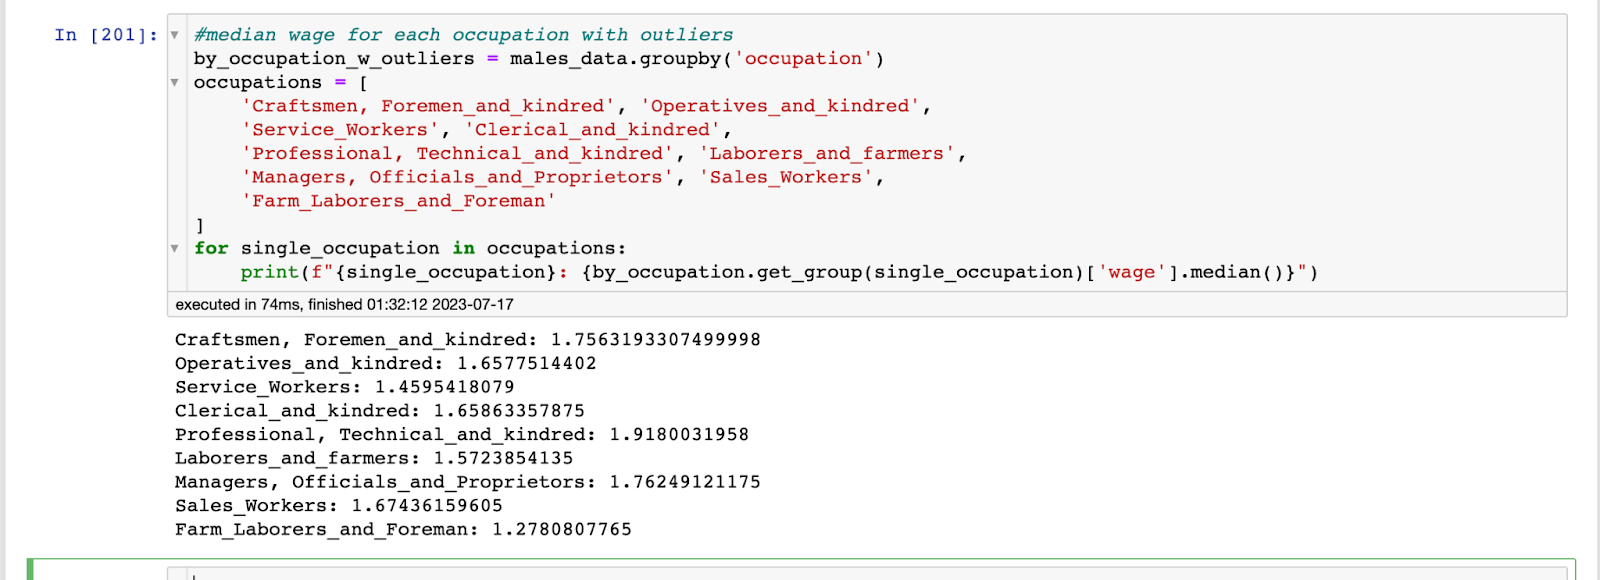
The median of the occupations' wage with outliers
Additionally, it’s important to note that data without outliers can offer comparable insights into the 50th percentile or median wage. Consequently, I would recommend utilizing the median when making decisions about the average wages for each occupation.
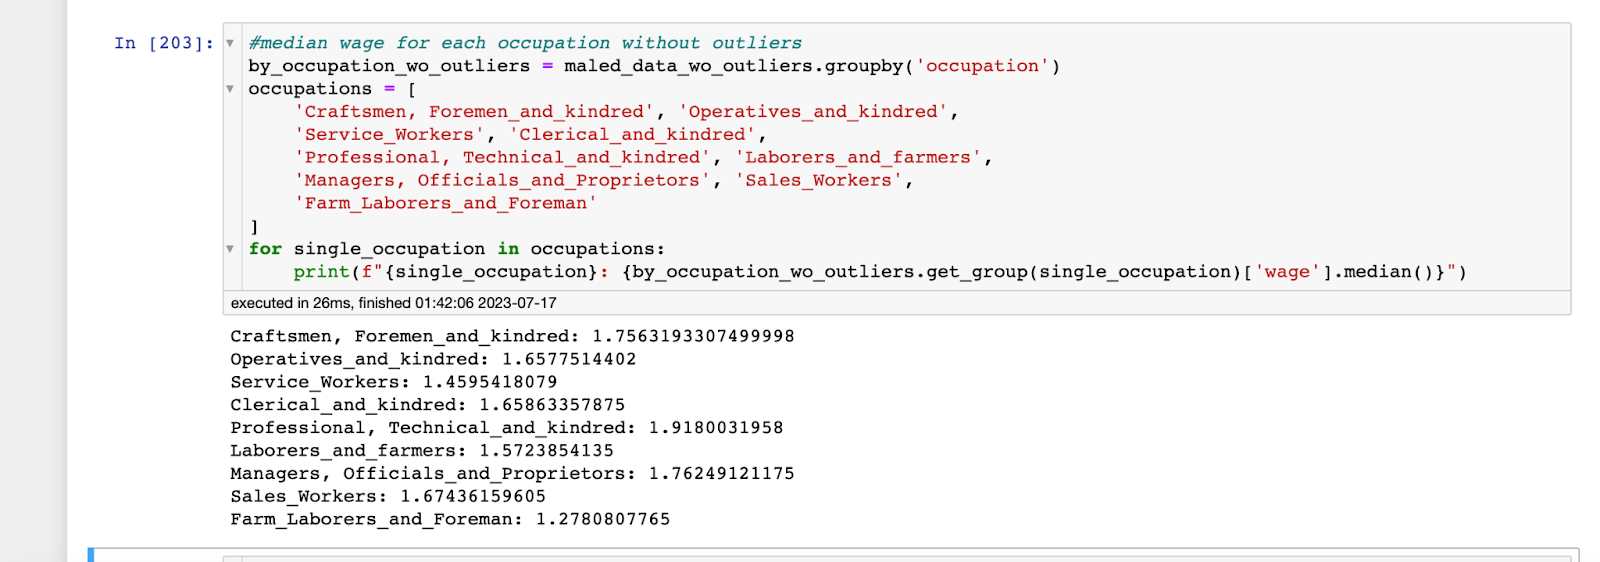
The median of the occupations’ wage without outliers
The above insights reveal to us that the data is right-skewed for young males in certain professions. This observation could be attributed to factors such as the demand for specific skills, educational requirements, and industry-specific opportunities for career growth. Consequently, young males in these professions may enjoy higher wages due to the increased demand for their expertise.
Relationship between the Observation Years and Wages:
Working with the Mean:
The data analysis, considering both the mean wage and the years with outliers, yields valuable information suggesting that earnings tend to increase over the years. Specifically, it reveals that male workers earned the most in 1987 and the least in 1980. This finding indicates that the year of observation played a significant role in determining the earning value. To gain further clarity on our assumptions, conducting an analysis without outliers and using the median would provide additional insights.
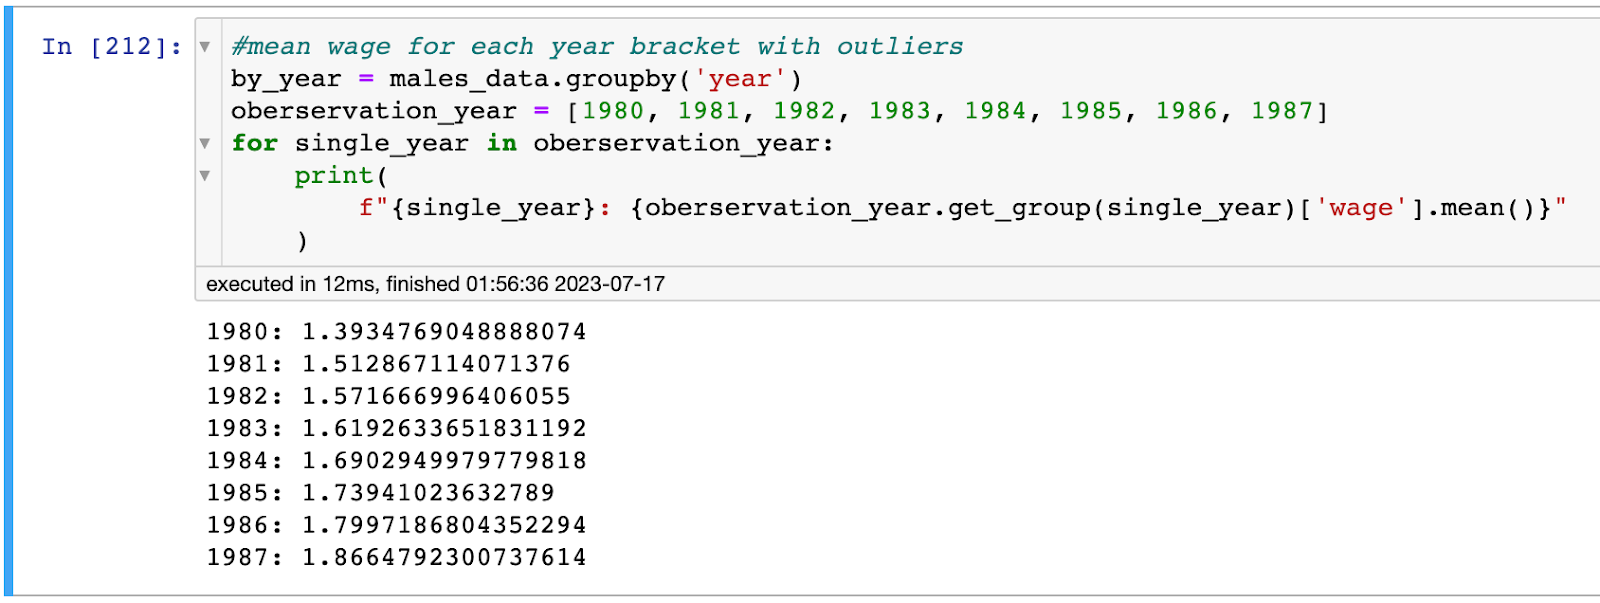
Mean wage with year with outliers
The data analysis below, considering the mean wage alongside the year without outliers, also indicates that male workers earned higher wages in later years. However, it is crucial to note that the wages for male workers without outliers reveal some years with notably higher mean wages, such as 1980–1986. This discrepancy might be due to some of the earners in the outliers being skewed towards the lower end, thus dragging down the overall values.
Interestingly, the data shows that in 1987, earners without outliers had a significantly lower wage, likely because the outliers for that year are more skewed towards the higher end. It will be intriguing to see what insights we will uncover once we compute the median of the data, both with and without outliers. This additional analysis will further enhance our understanding of the wage distribution and the impact of outliers on the overall results.
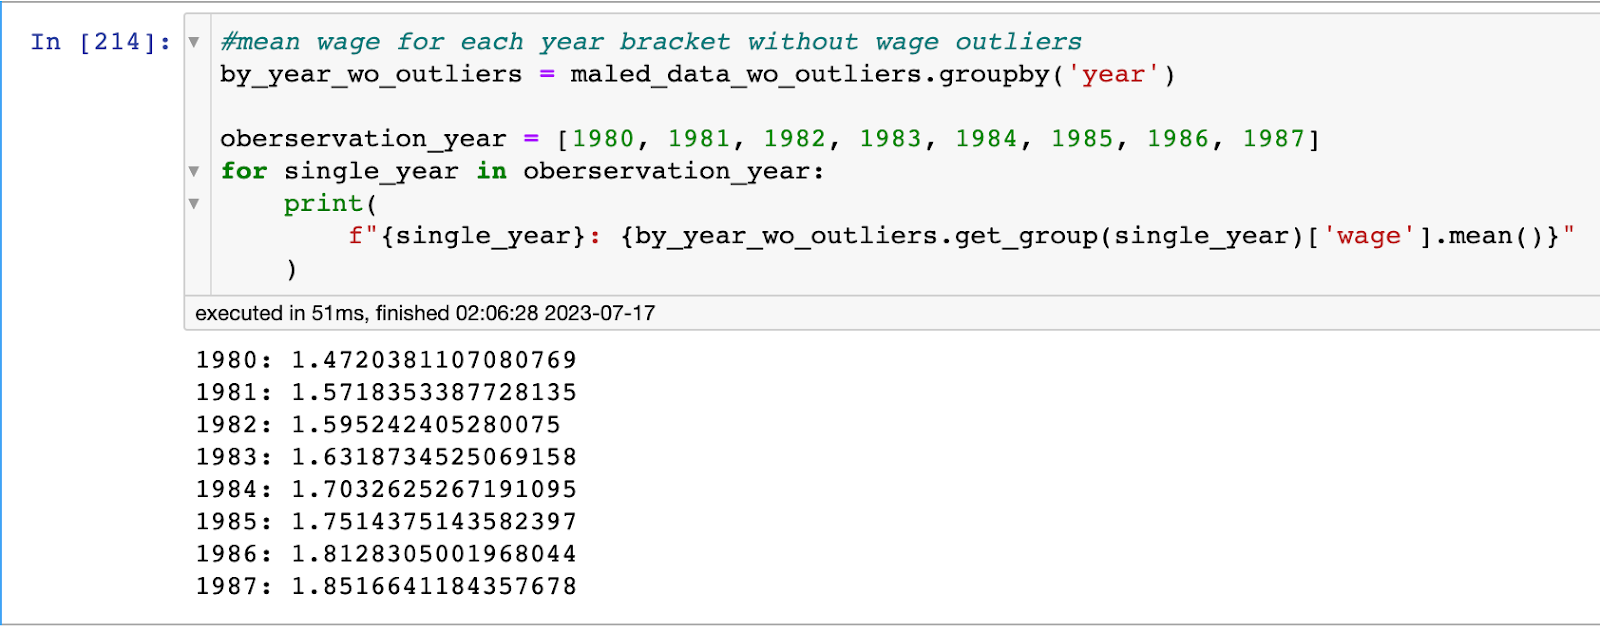
Mean wage with the year without outliers
Working with the Median:
The analysis of median wages for each year, both with and without outliers, confirms the previous insight that male workers tend to earn higher wages over the years. This increase in wages could potentially be attributed to the accumulation of work experience over time.
Furthermore, it is essential to highlight that there has been a consistent increment in worker wages over the years, as supported by data from https://www.ssa.gov/oact/cola/AWI.html.
The comparison between median and mean values also reveals interesting findings. Some years have median wages higher or lower than the mean values. This indicates that outliers, as observed in the previous analysis, indeed have a significant influence on the outcomes.
Notably, the median wages without outliers were higher, further supporting the assumption that these outliers play a role in the results. This discrepancy in median values for data with and without outliers provides a solid foundation for conducting a more in-depth exploration of these outlier data points. By examining the outliers from another perspective, we can gain additional insights and better understand their impact on the overall wage distribution.
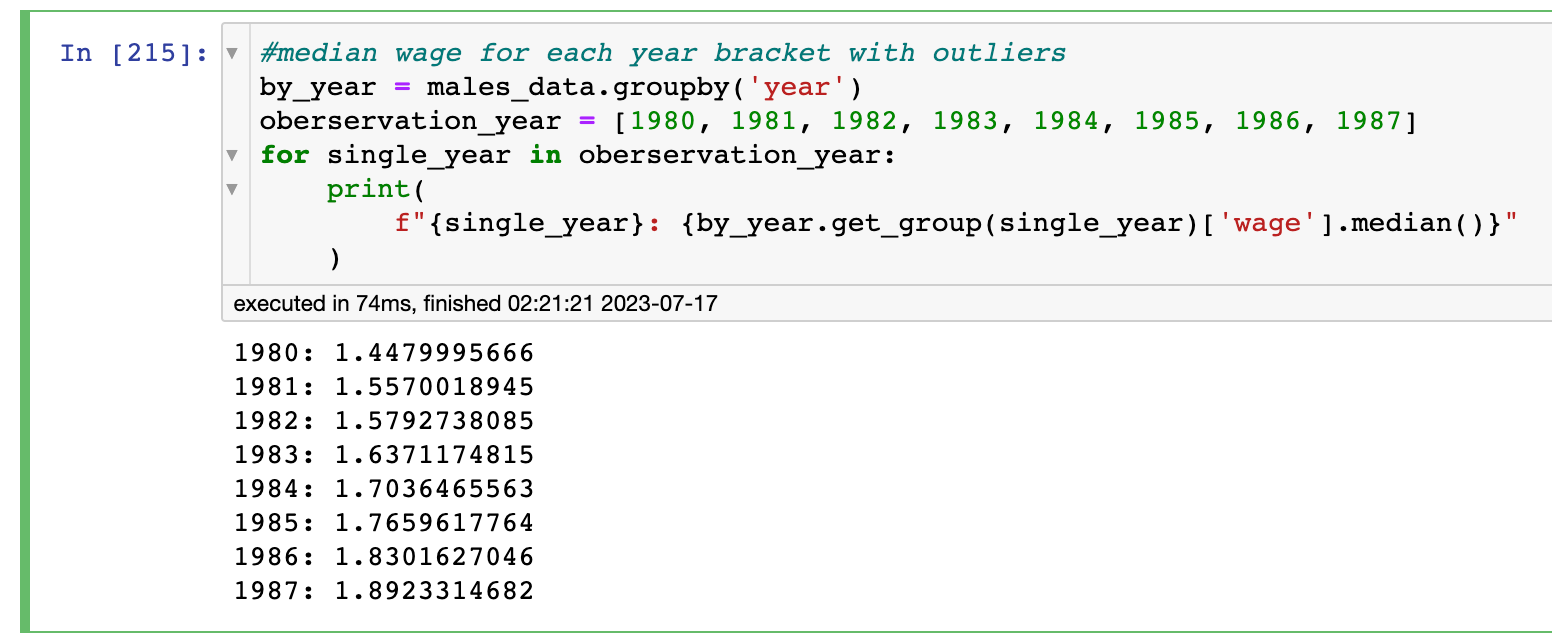
The median wage for each year with outliers
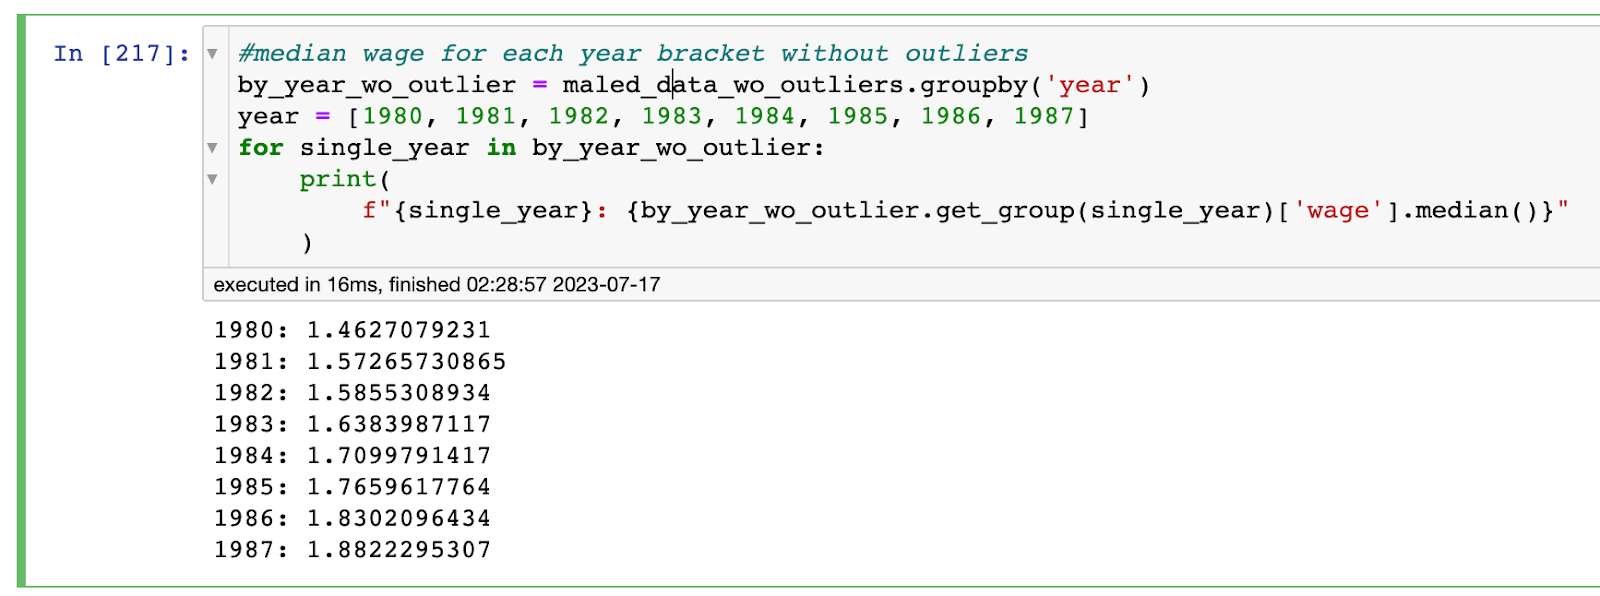
The median wage for each year without outliers
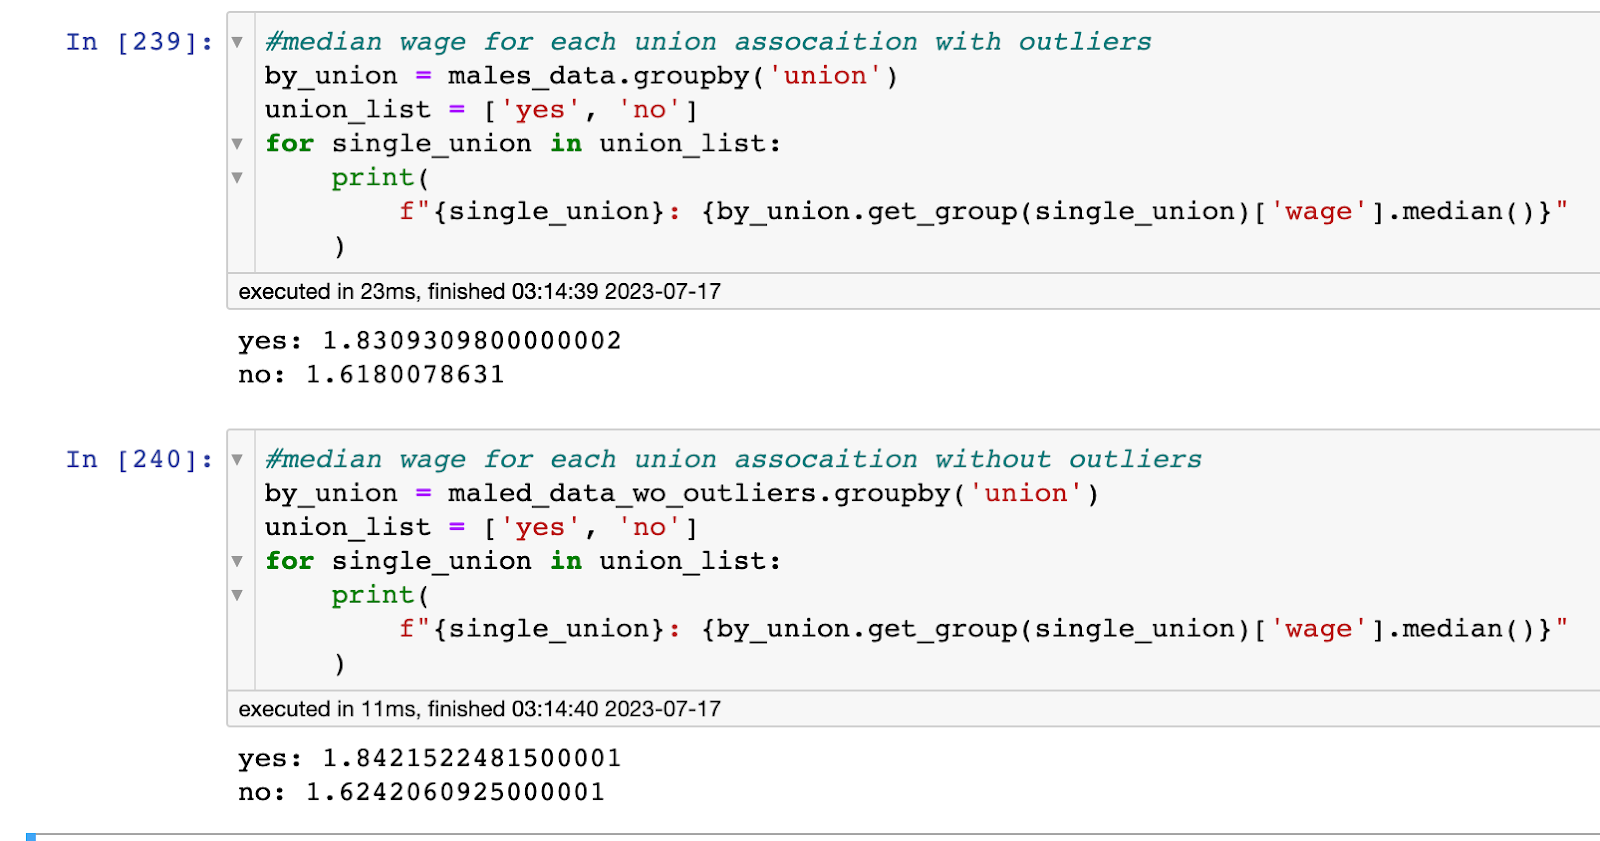
Relationship between the Union Association and Wages:
Our data analysis shows that young male workers belonging to a union have significantly higher median pay compared to non-union workers. The median values consistently outshine the mean values, especially when outliers are considered, emphasizing the impact of outliers on wage calculations. Further, a detailed examination of individual occupations reveals that certain professions experience a more substantial benefit from union membership than others.
It is crucial to delve deeper into the reasons behind these variations. For instance, in professions with higher union representation, collective bargaining power might lead to better wage negotiations and improved working conditions for unionized workers. However, it is essential to remain mindful of other contributing factors, such as industry-specific labor market conditions and the influence of employer-union relationships on wage dynamics.
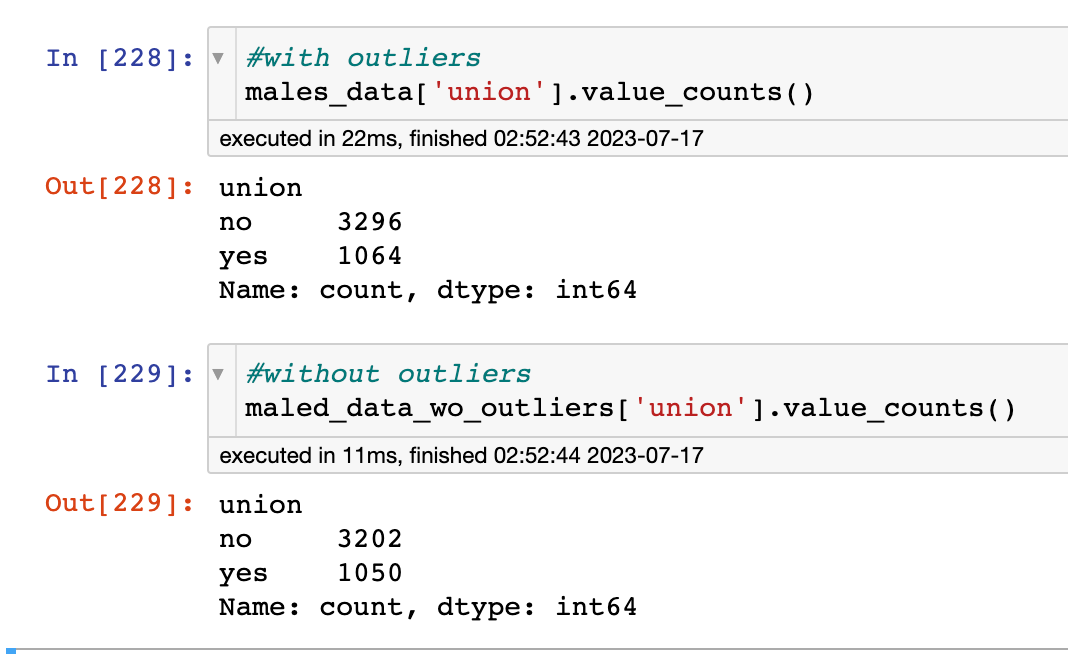
Number of Workers belonging and not belonging to a union with and without outliers
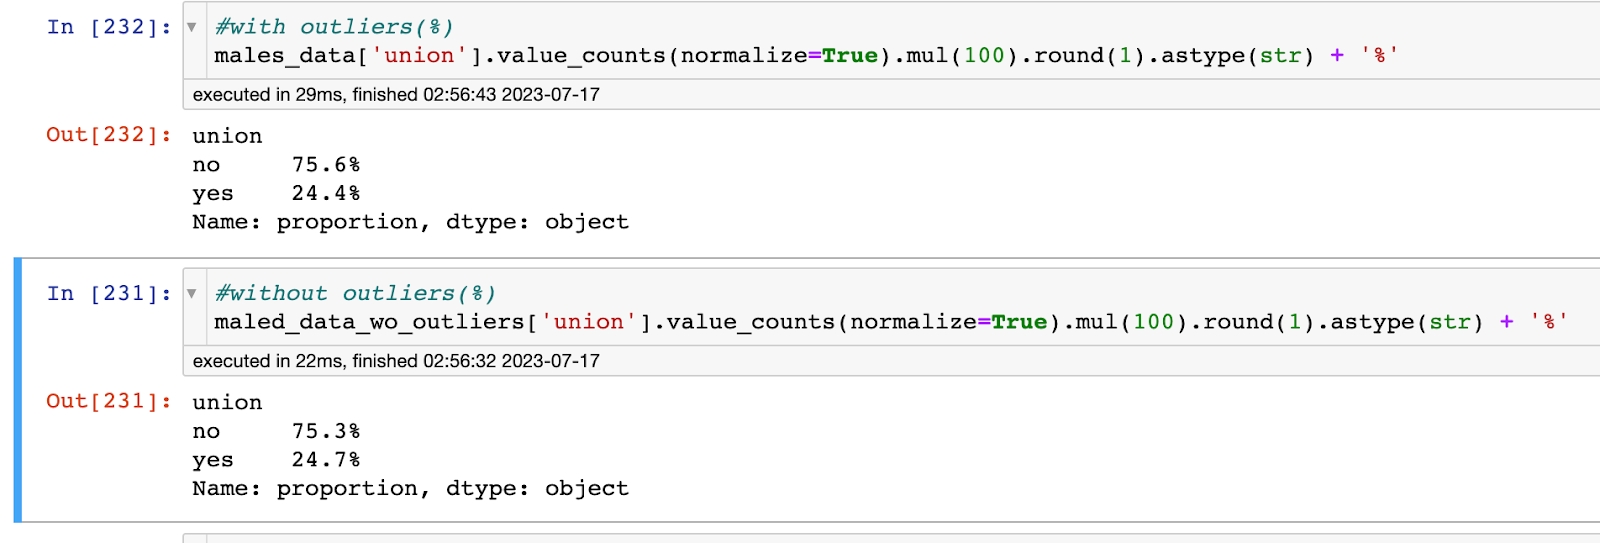
% of Workers belonging and not belonging to a union with and without outliers
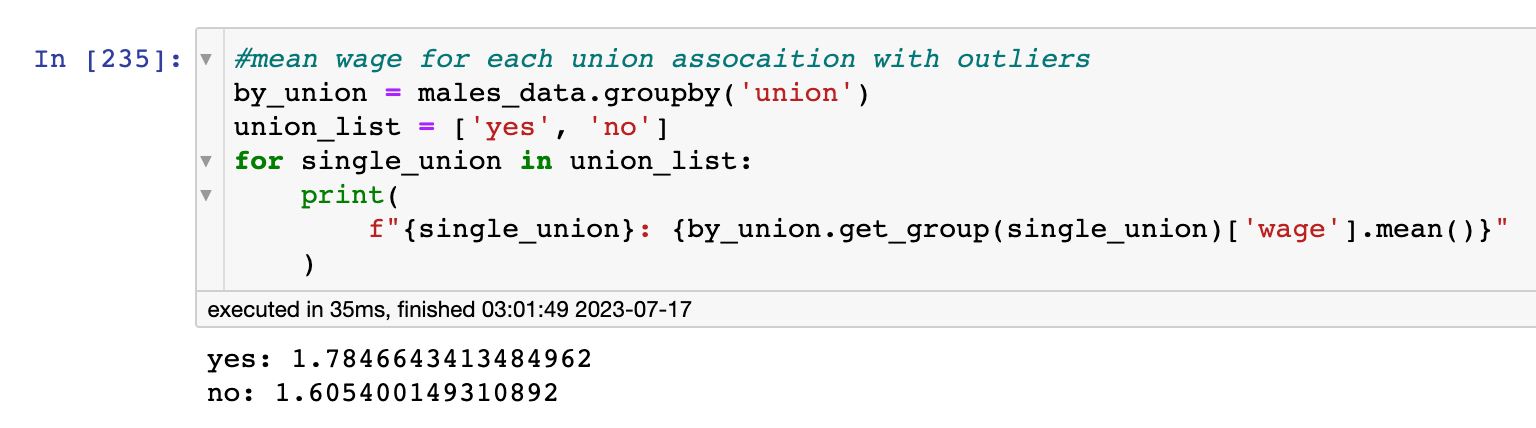
the mean wage of male workers belonging and not belonging to a union with outliers
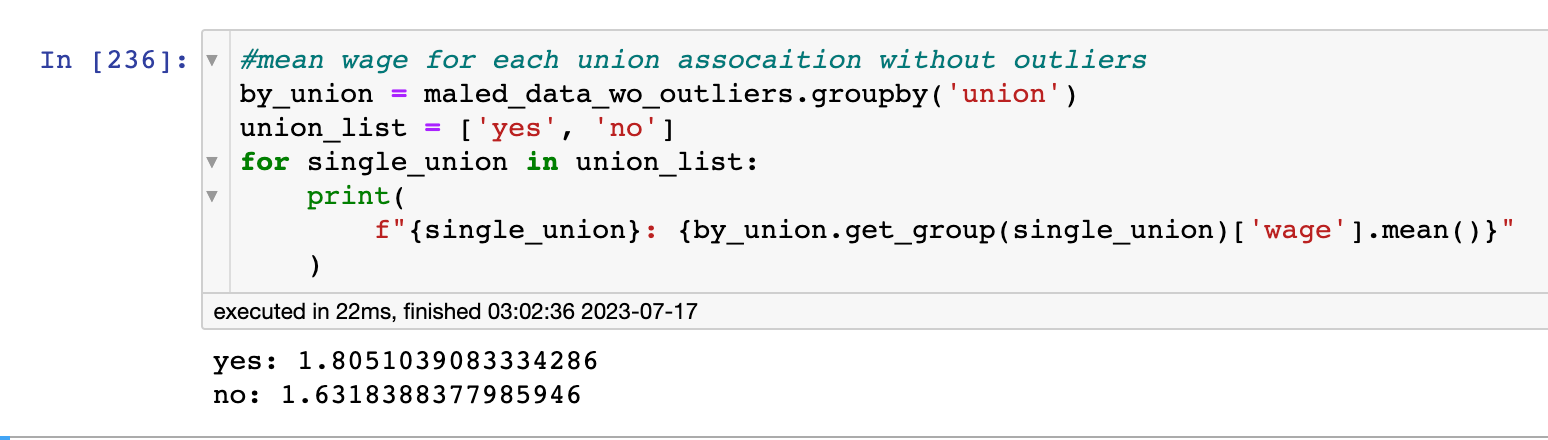
mean wages of male workers belonging and not belonging to a union without outliers
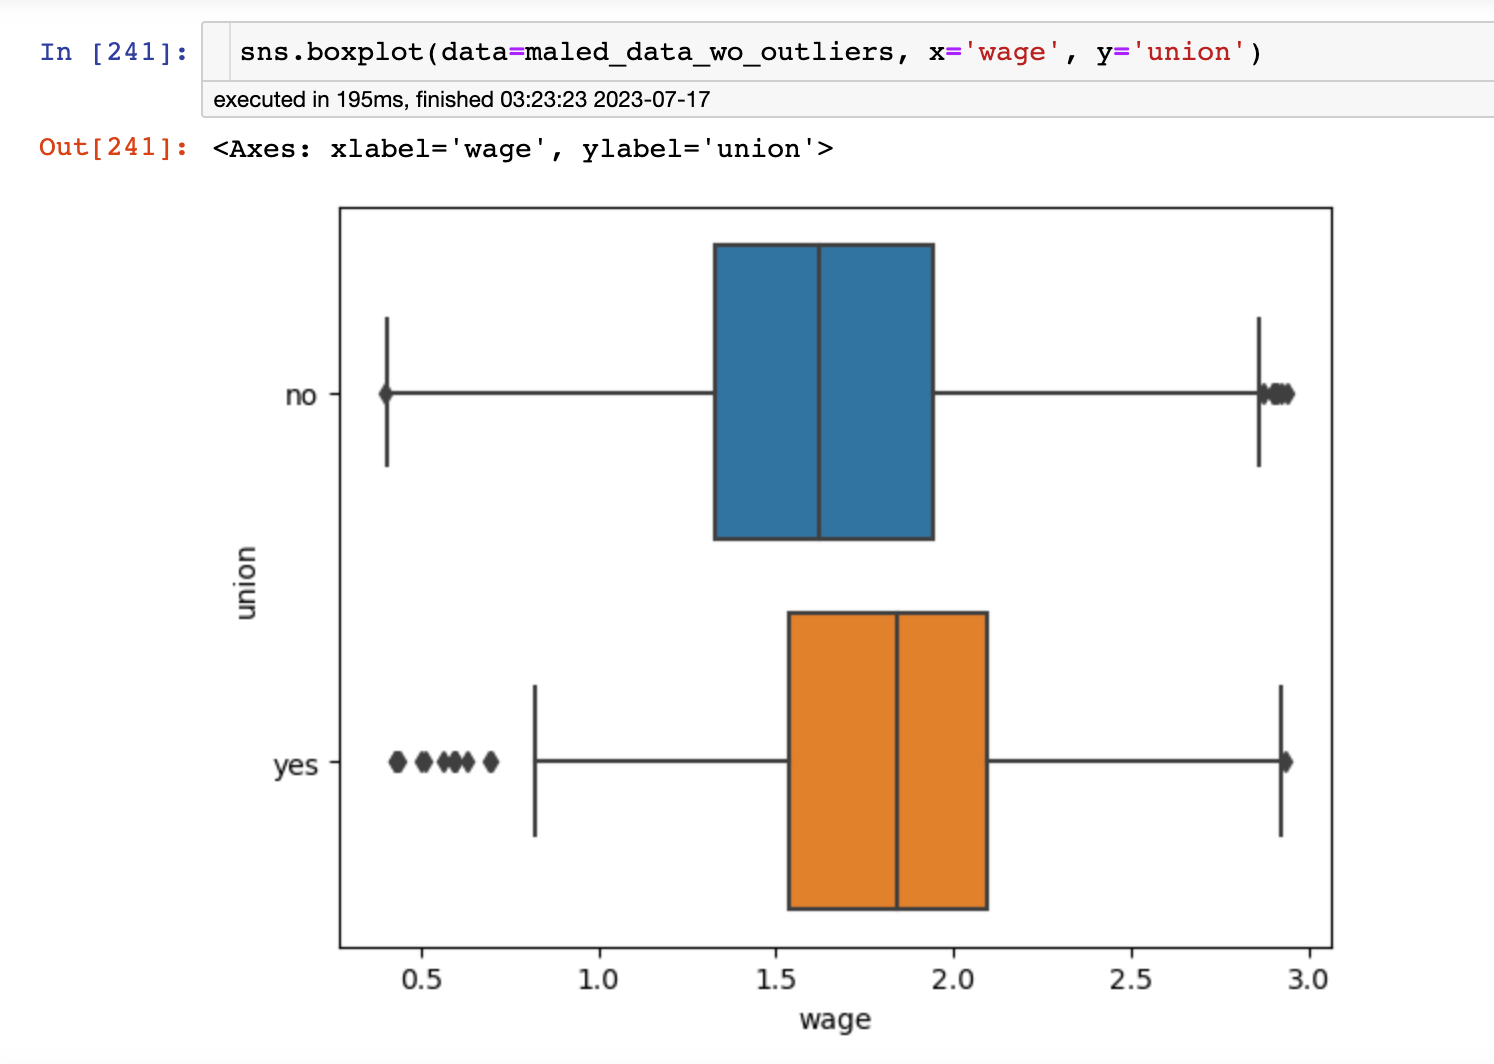
Box plot of the wage without outliers
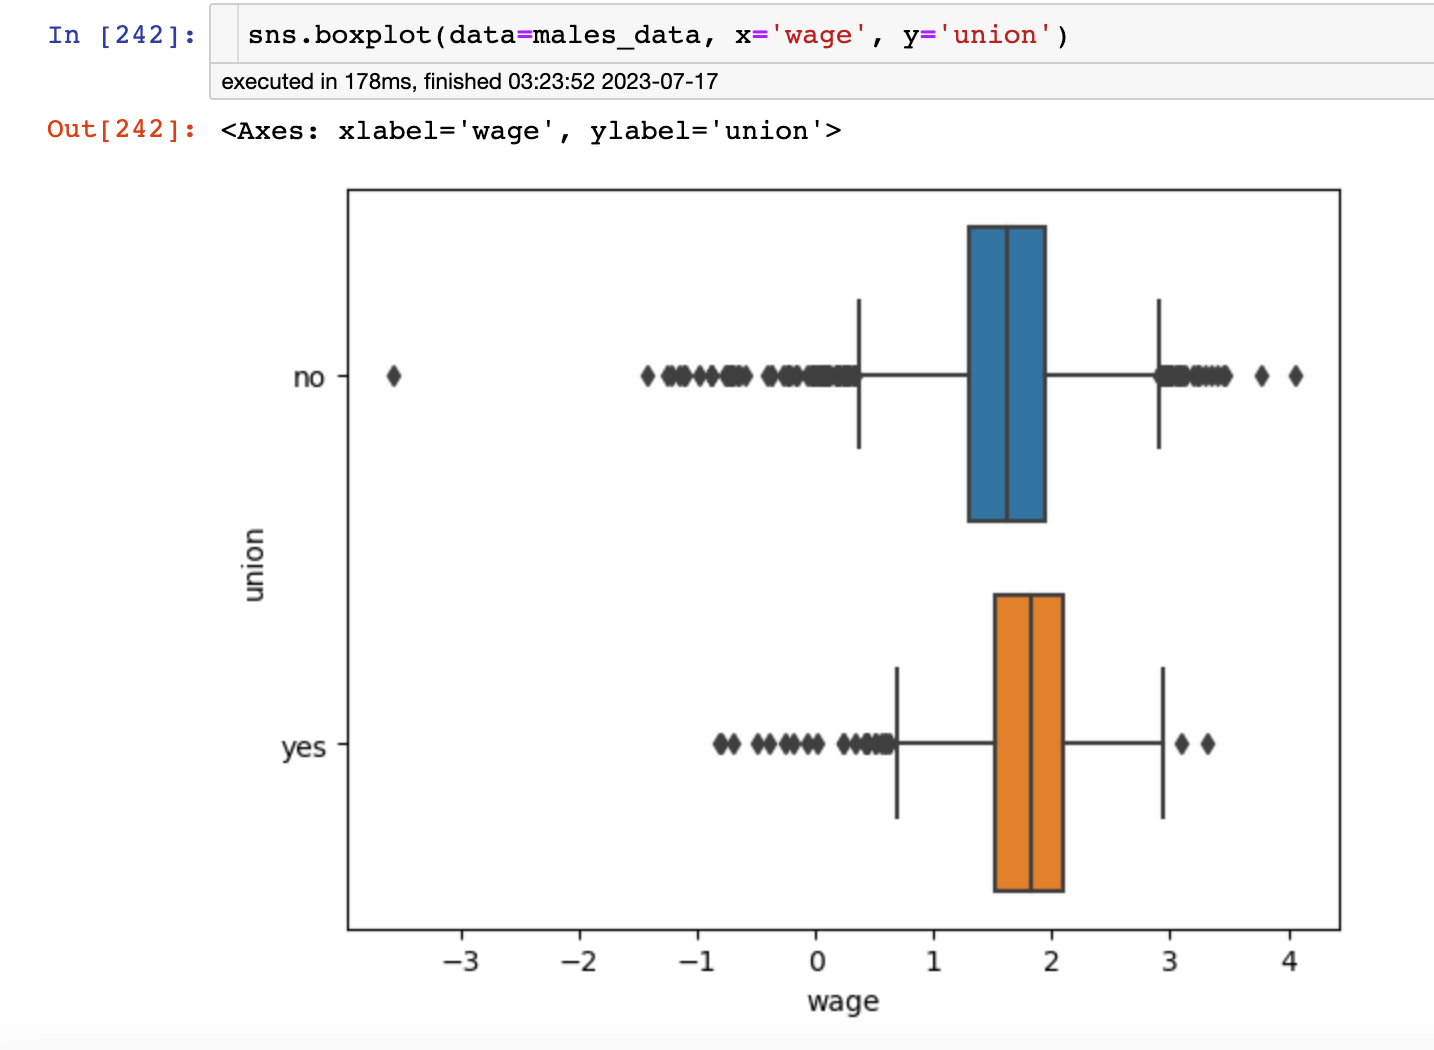
Box plot of the wage with outliers
Based on the data insight and the median wage analysis below, it is evident that belonging to a union indeed has a substantial impact on the average wage earned by male workers. Workers who are part of a union tend to have a higher chance of receiving better wages.
the median wage of male workers belonging and not belonging to a union with and without outliers
Additionally, it is worth noting that the median values for wages based on union association are considerably higher compared to the mean values. This discrepancy suggests that the presence of outliers has a significant influence on the mean, potentially pulling it in either direction.
To ensure a less biased decision post-data analysis, it is advisable to rely on the median values rather than the mean. The median is less affected by extreme outlier values, providing a more representative measure of the typical wage earned by male workers in unions and those not in unions.
Therefore, opting to use the median value without considering outliers would likely yield a more accurate and reliable understanding of the impact of union association on male workers’ wages. This approach helps to mitigate the distorting effects of outliers and results in a more robust decision-making process.
Relationship between Occupation, Union, and Wage
Upon analyzing the data without outliers and drilling down into specific occupations, we observe that Craftsmen, Foremen_and_kindred workers benefit the most from being in a union. Their mean wage (~1.94) is higher than the mean wage (~1.81) for all male workers in a union. Furthermore, their median wage (50%) (~1.97) significantly surpasses the median wage (~1.84) for all male workers in a union.
On the other hand, the data reveals that Farm_Laborers_and_Foreman workers benefit the least from being in a union. However, it would be insightful to compare their situation with their fellow male workers who are not part of a union to gain a better understanding of the impact of union association on this particular occupation.
By examining how the wages of Farm_Laborers_and_Foreman workers compare to their non-unionized counterparts, we can assess whether being in a union truly provides a tangible advantage in this specific occupation. This comparison will shed light on whether the disparity in wages is primarily due to union membership or other factors influencing their earnings.
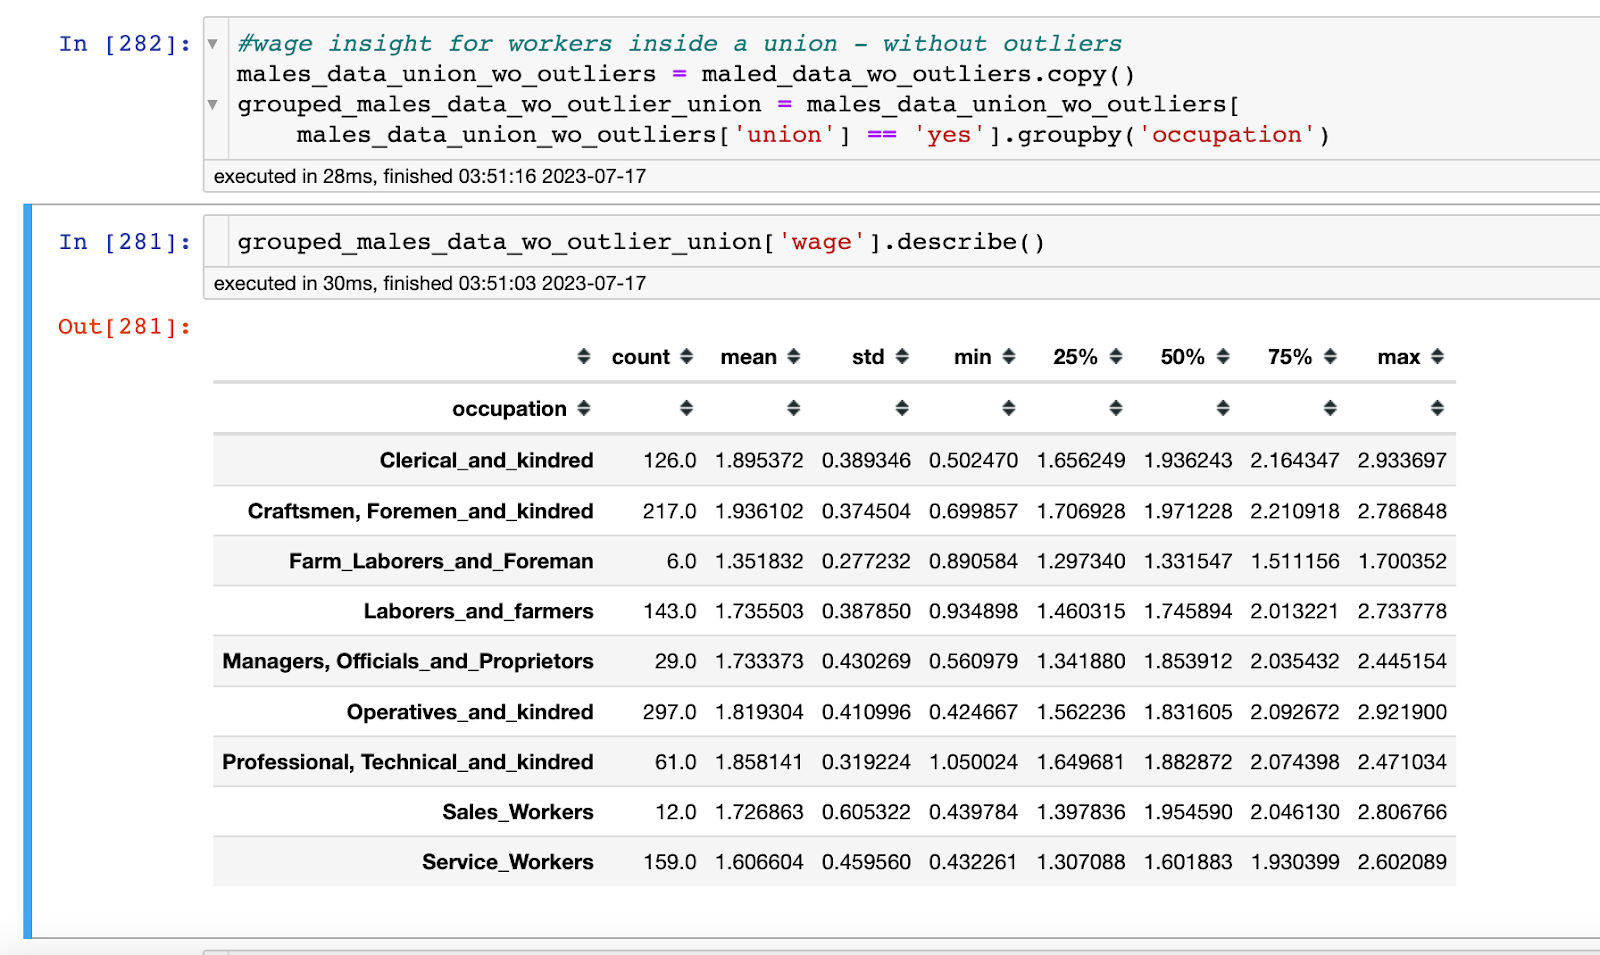
A description of the wage with union association, and occupation relationship without outliers
Indeed, the data insight for workers not in a union provides interesting observations regarding the impact of union membership on different occupations. Let’s delve into the findings for specific professions:
Professional, Technical_and_kindred workers: The mean and median wages for this occupation indicate that workers in this category do not seem to benefit significantly from joining a union. However, it is worth considering that other factors, such as age, may play a role in influencing their wages.
Sales_Workers: Workers in the Sales occupation appear to experience considerable benefits from joining a union, as indicated by higher mean and median wages.
Craftsmen_Foremen_and_kindred workers: This occupation shows clear advantages for workers who belong to a union, with higher mean and median wages.
Managers, Officials_and_Proprietors: Similarly, those in managerial roles also seem to benefit from union membership, showing higher mean and median wages.
These observations suggest that the impact of union membership varies across different professions. Some occupations show substantial advantages for unionized workers, while others may not experience the same level of benefits. Factors like the type of work, industry, and regional differences could also influence these outcomes.
To gain a comprehensive understanding, it is essential to consider additional factors such as experience levels, educational qualifications, and other demographic variables that may affect wages in each occupation. Such detailed analysis will help discern the true impact of union membership on the earnings of workers in various fields.
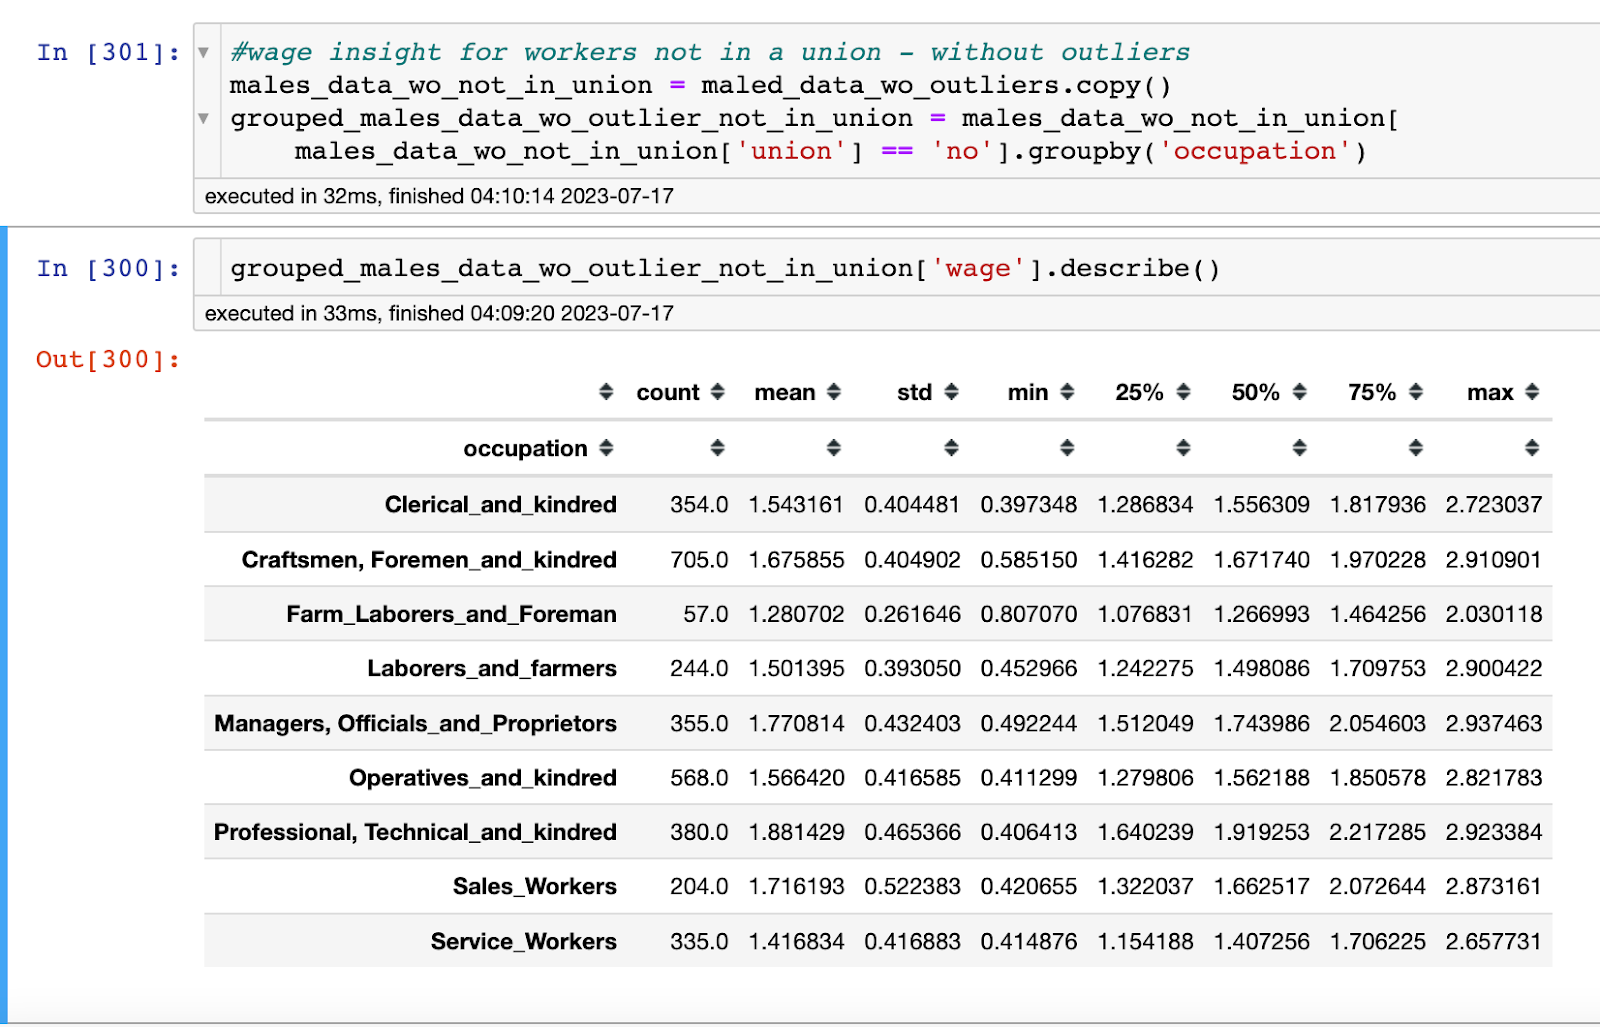
A description of the wages with no union association, and occupation relationship without outliers
Relationship between Years of Experience and Wage
Our investigation into the relationship between years of experience and wages shows that while initial years of experience might lead to wage increases, there seems to be a saturation point. Additional years of experience do not necessarily translate into higher wages. This phenomenon is possibly influenced by factors such as occupation and economic conditions during the 1980s.
We must also consider that individual career trajectories can vary significantly based on factors such as educational background, skill development, and opportunities for advancement. Experience alone may not be the sole determinant of wage growth.
The data insight with outliers indicates that, on average, male workers with 9 years of experience had the highest mean wage, while those with just 1 year of experience had the least. However, the data also suggests that an increase in work experience beyond a certain point does not significantly impact wages. There appears to be a wage ceiling, where additional years of experience no longer lead to substantial wage increases. This ceiling could be influenced by various factors, including the nature of occupations and workers’ educational backgrounds. It is also essential to note that the presence of outliers may have influenced the mean wage values, and it is recommended to consider the data without outliers for a more accurate analysis.
Additionally, considering the historical context of the 1980s recession and high inflation in the US, as mentioned in the provided by [²^] Wikipedia, it is plausible that the rising inflation may have led to employers’ budget constraints, resulting in a possible stagnation of wage increases during that period.
Also, the data insight without outliers confirms the previous findings, indicating a similar scenario where an increase in work experience no longer leads to significant wage increases. The data shows a wage ceiling for male workers, beyond which additional years of experience do not substantially impact wages. As mentioned before, various factors such as occupation and education may be contributing to this phenomenon.
It is important to reiterate that analyzing the data without outliers is essential to obtain a more accurate representation of wage trends based on experience, as outliers can distort the mean values. Further research and analysis are necessary to gain a deeper understanding of the factors influencing male workers’ wages, especially in light of historical economic contexts and other relevant factors.
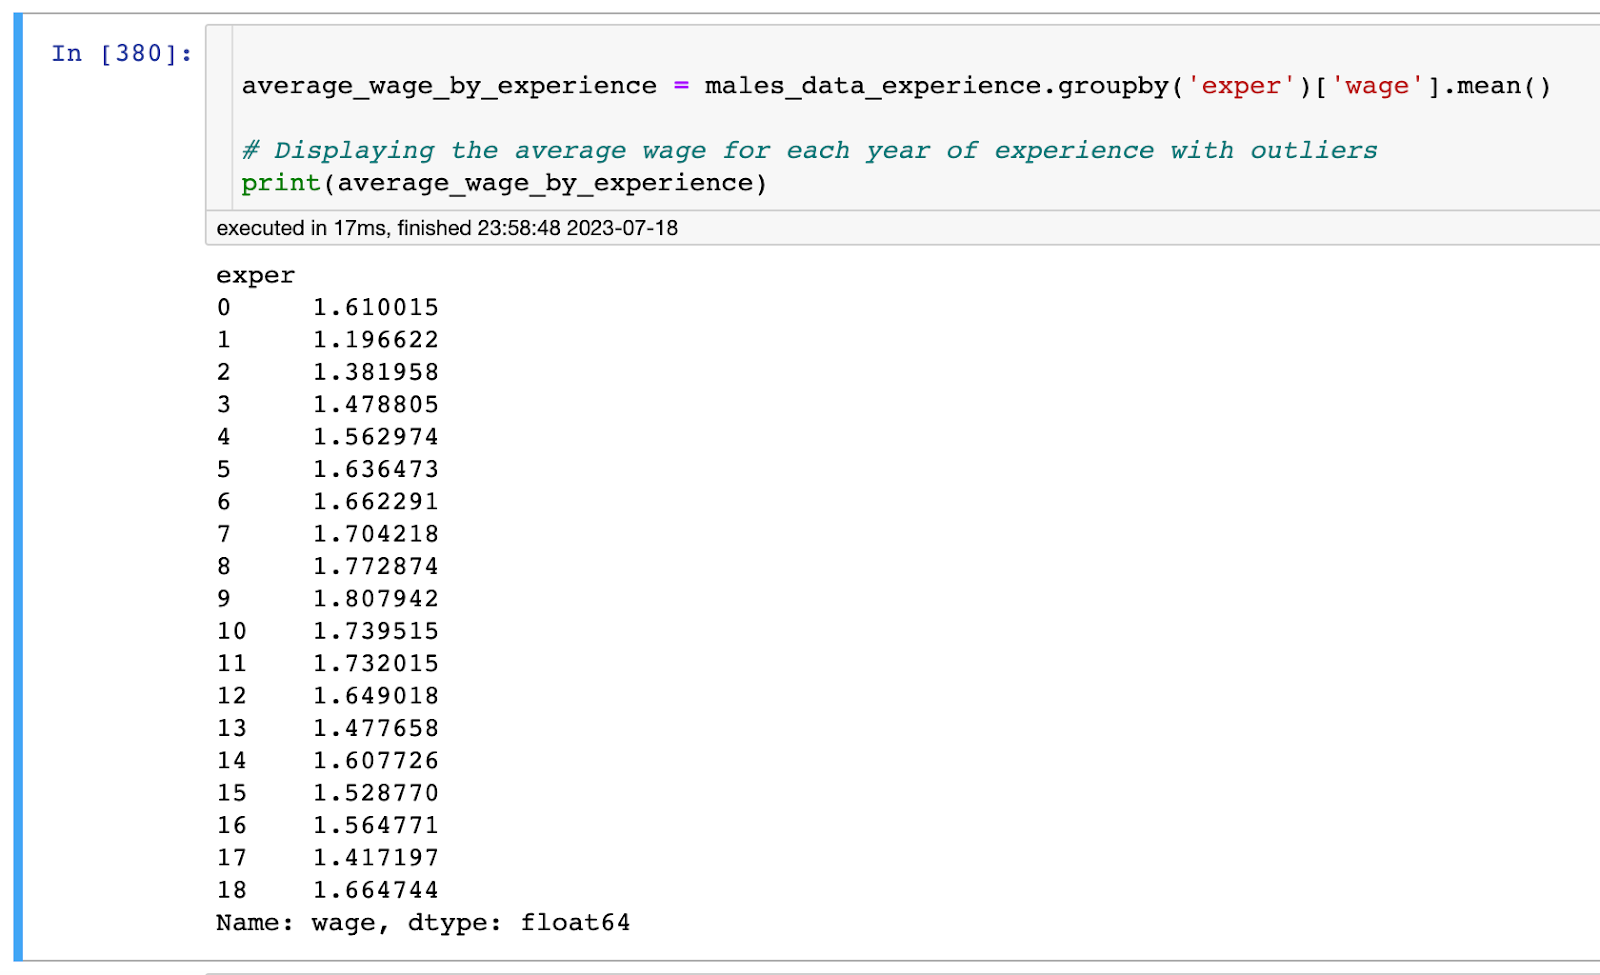
the average wage for the number of years of experience with outliers
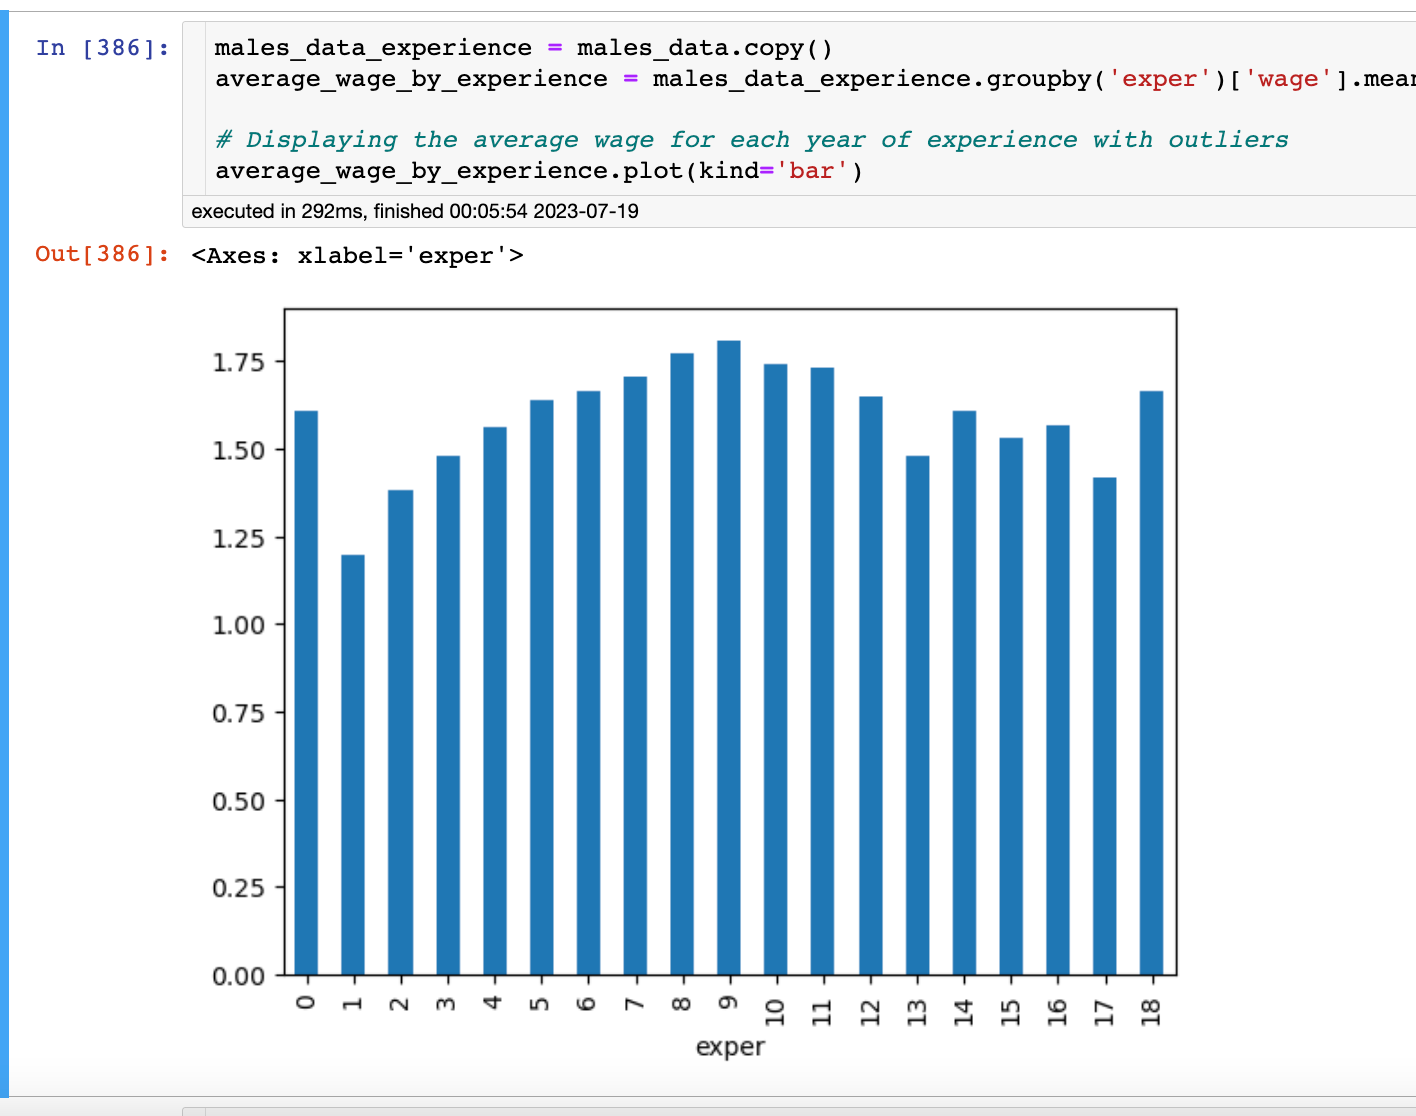
a bar chart showing the average wage for the number of years of experience with outliers.
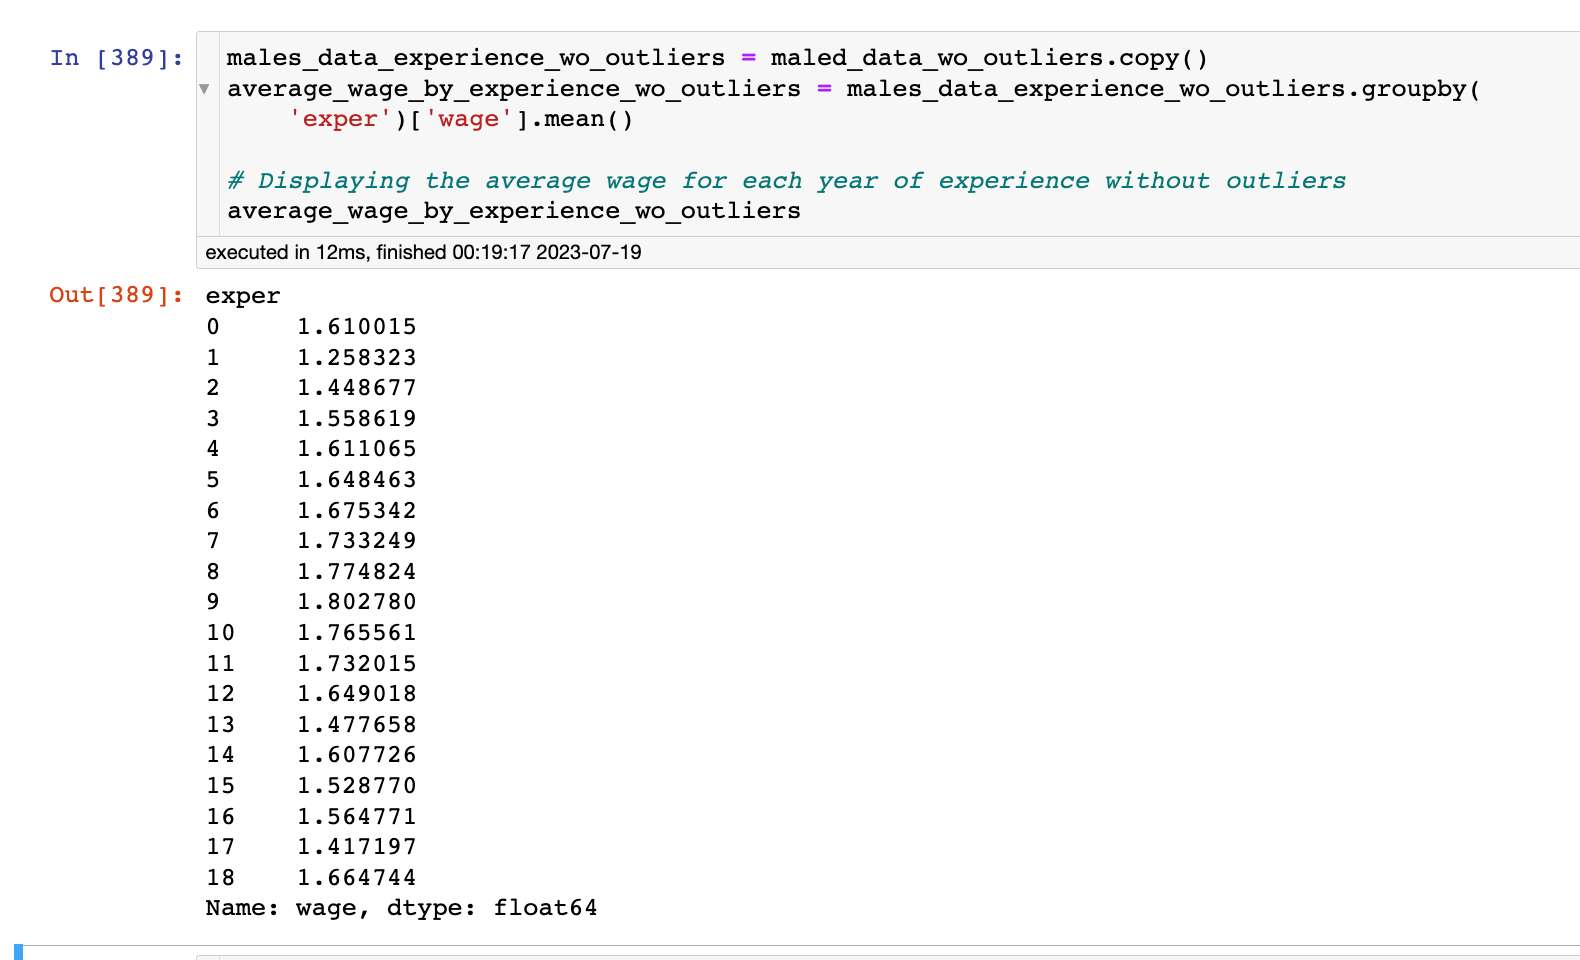
the average wage for the number of years of experience without outliers.
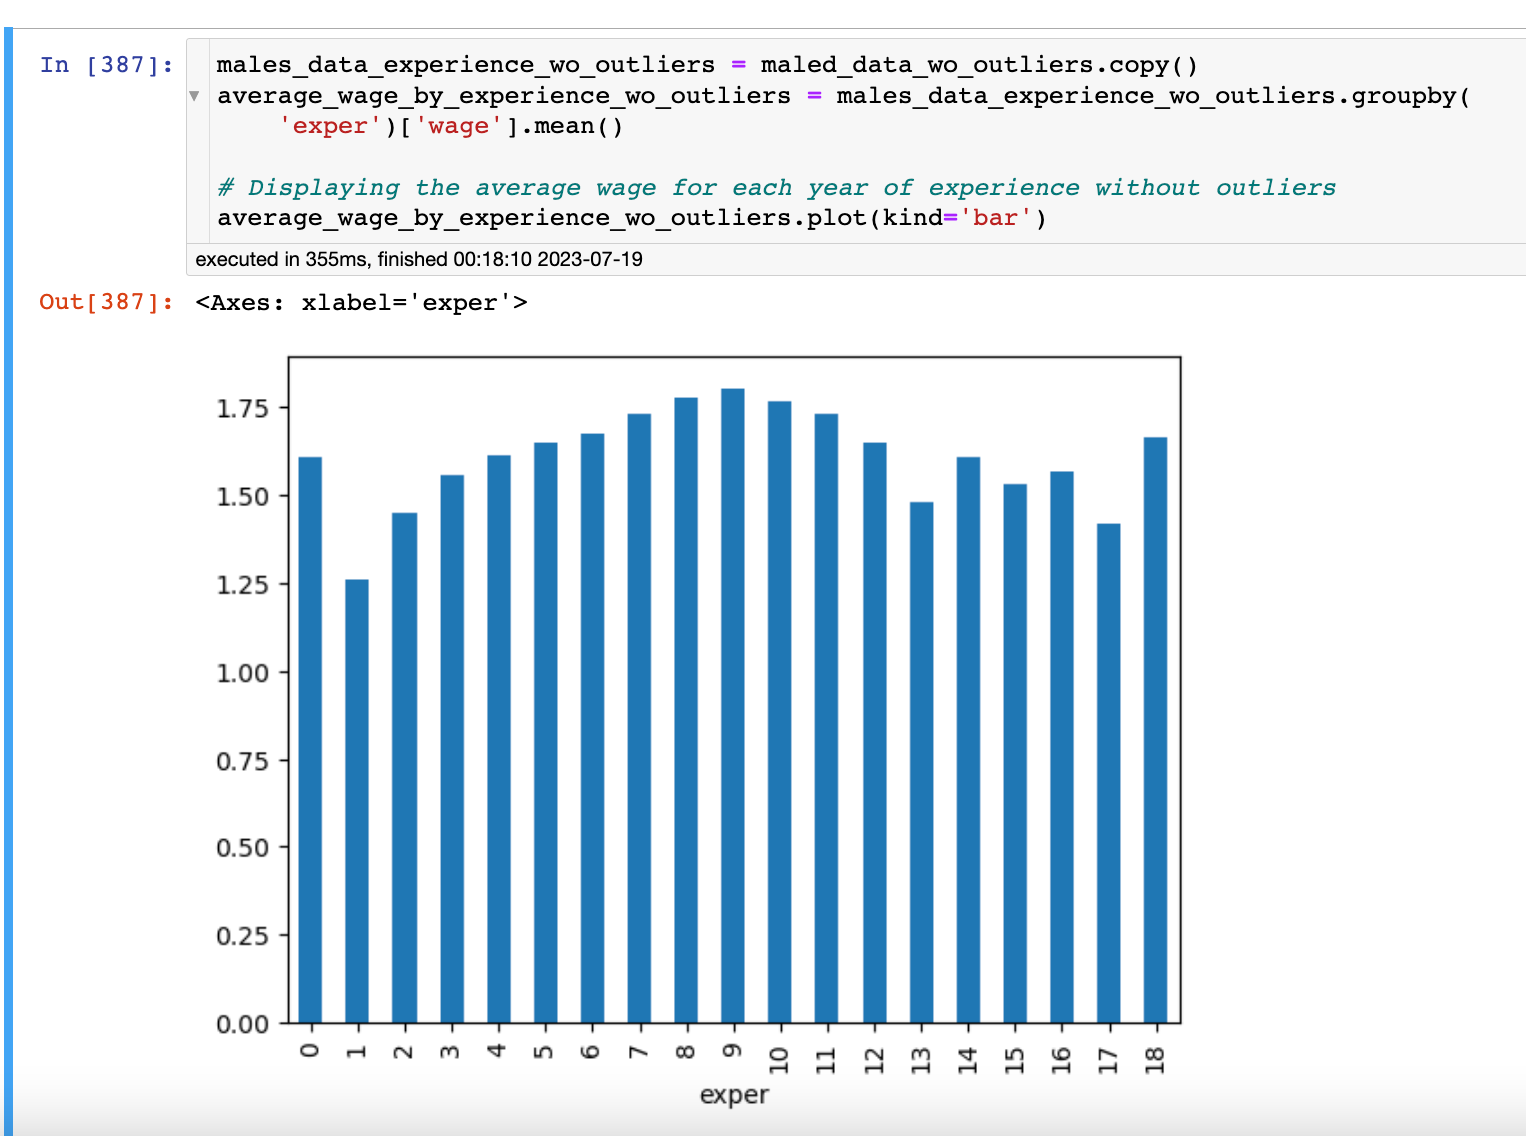
a bar chart showing the average wage for the number of years of experience without outliers.
Conclusion:
Our analysis of wage data for young male workers between 1980 and 1987 has offered valuable insights into various aspects of their earnings. From comparing wages to the government minimum wage to exploring the impact of union affiliation and years of experience, we have uncovered significant patterns that contribute to wage disparities. Additionally, we have emphasized the role of outliers in data analysis and highlighted the importance of using median values to mitigate the skewness introduced by extreme data points. Understanding these intricacies will help us make more informed decisions when interpreting wage data and addressing disparities in the workforce.
As we conclude this exploration, it’s crucial to remember that the insights gained from this analysis can serve as valuable inputs for policymakers and stakeholders to implement strategies that foster fair wages and equal opportunities in the workplace.
Citations:
[¹^] Montana government website. “Minimum Wage History.” Retrieved from erd.dli.mt.gov/labor-standards/wage-and-hou..
[²^] Wikipedia. “Early 1980s Recession.” Retrieved from en.wikipedia.org/wiki/Early_1980s_recession..